
该问题来自社区帖: https://bbs.csdn.net/topics/617435362.为符合问答规范, 该问题经过ChatGPT优化
<html></html>
<html></html>
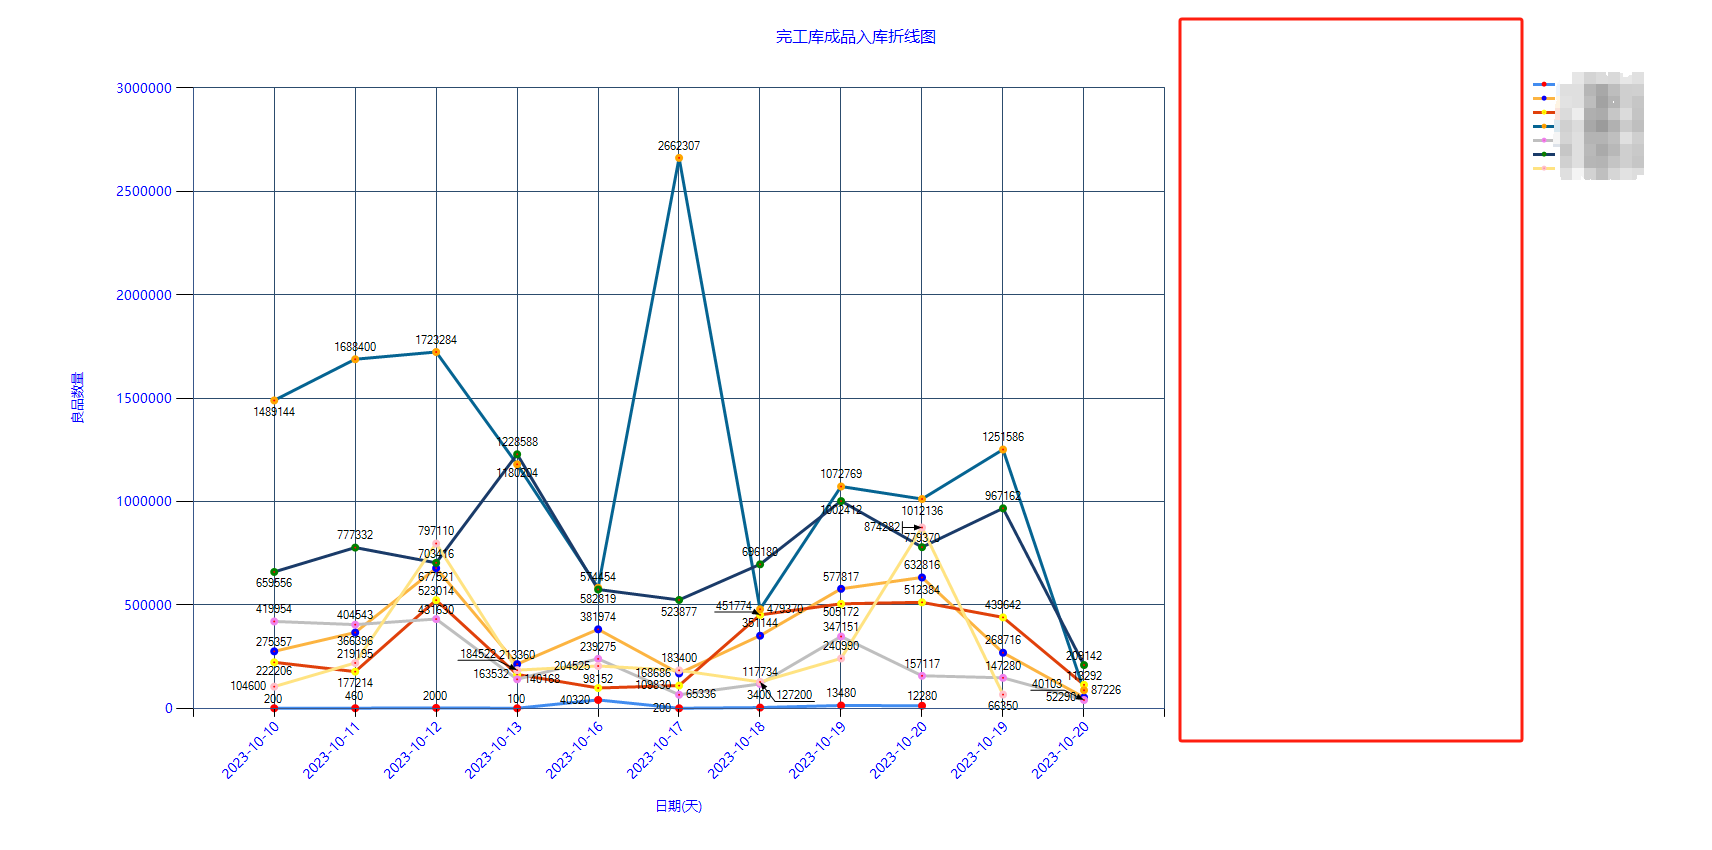
如下图所示,这个右上角很大一片空白,如果右上角的Legends去掉,又是好的,怎么把这个空白处填满,急等
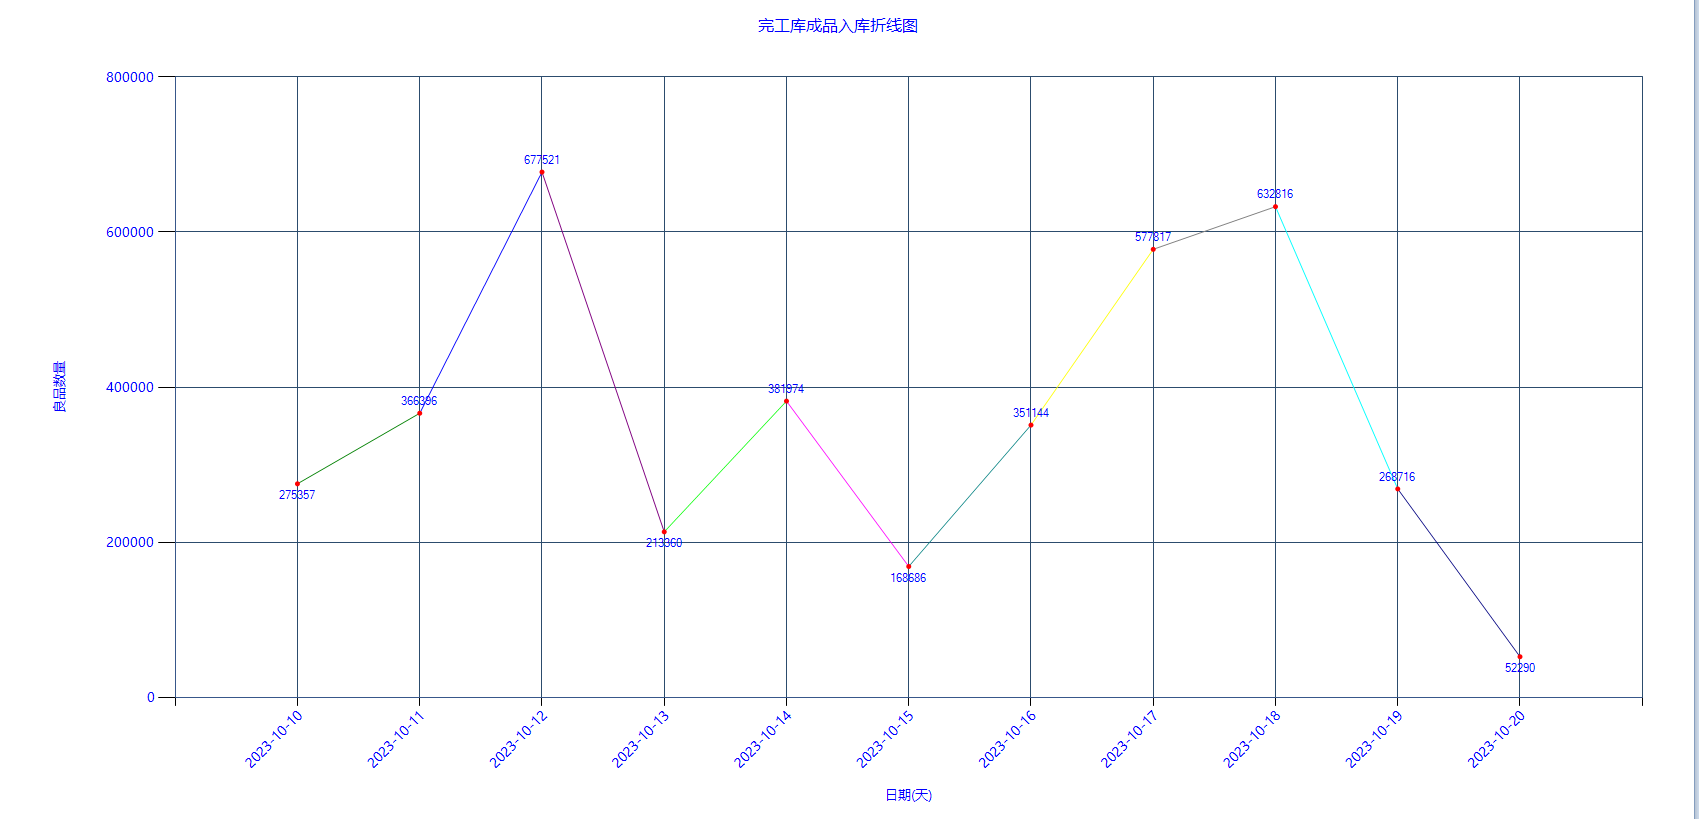
下面是去掉Legends的
后台代码如下:
chart1.Series.Clear(); chart1.Legends.Clear(); int i = 0; foreach (DataRow drW in _dtWh.Rows) { List<string> slistX = new List<string>(); List<float> slistY = new List<float>(); foreach (DataRow dr in drs) { } string[] x = slistX.ToArray(); float[] y = slistY.ToArray(); chart1.Legends.Add(new Legend()); chart1.Legends[i].Name = drW["cWhName"].ToString(); chart1.Legends[i].Docking = Docking.Right; chart1.Legends[i].Alignment = StringAlignment.Near; chart1.Legends[i].LegendStyle = LegendStyle.Column; chart1.Series.Add(new Series()); chart1.Series[i].Name = drW["cWhName"].ToString(); chart1.Series[i].Label = "#VAL"; chart1.Series[i].ToolTip = "#VALX\r#VAL"; chart1.Series[i].ChartArea = chart1.ChartAreas[0].Name; chart1.Series[i].ChartType = SeriesChartType.Line; chart1.Series[i].Points.DataBindXY(x, y); if (i == 0) chart1.Series[i].Points[0].Color = Color.Red; else if (i == 1) chart1.Series[i].Points[0].Color = Color.Blue; else if (i == 2) chart1.Series[i].Points[0].Color = Color.Yellow; else if (i == 3) chart1.Series[i].Points[0].Color = Color.Orange; else if (i == 4) chart1.Series[i].Points[0].Color = Color.Violet; else if (i == 5) chart1.Series[i].Points[0].Color = Color.Green; else if (i == 6) chart1.Series[i].Points[0].Color = Color.Pink; else if (i == 7) chart1.Series[i].Points[0].Color = Color.Gold; chart1.Series[i].BorderWidth = 3; chart1.Series[i].MarkerBorderColor = chart1.Series[i].Points[0].Color; chart1.Series[i].MarkerBorderWidth = 3; chart1.Series[i].MarkerColor = Color.Red; chart1.Series[i].MarkerSize = 5; chart1.Series[i].MarkerStyle = MarkerStyle.Circle;


