
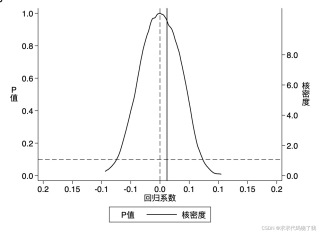
调整完图表如下,但是没有真实值的空心圈
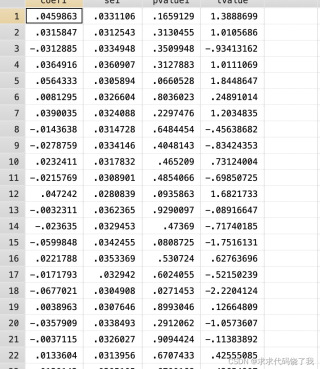
这是我的数据集,数据如下
这是我画图的代码
twoway (scatter pvalue1 coef1, msymbol(smcircle_hollow) mcolor(black)) (kdensity coef1 ,yaxis(2) lp(solid) lc(black)) , title("") xlabel(-0.1(0.05)0.1,format(%7.1f) angle(0)) ylabel(0(0.2)1, format(%7.1f) angle(0) nogrid axis(1)) ylabel(0(2)8, format(%7.1f) angle(0) nogrid axis(2)) xtitle("回归系数") ytitle("P" "值" ,orientation(horizontal) axis(1)) ytitle("核" "密" "度" ,orientation(horizontal) axis(2)) xline(0, lwidth(0.2) lp(dash) lc(black)) xline(0.012, lwidth(0.3) lp(solid) lc(black)) yline(0.1,lwidth(0.2) lp(dash) lc(black))legend(label(1 "P值") label( 2 "核密度")) plotregion(style(none)) graphregion(color(white))
为什么真实值没有圈圈呢,用什么代码可以处理呢


