有没有好用的开源免费的适用于springboot项目的api监控服务啊。
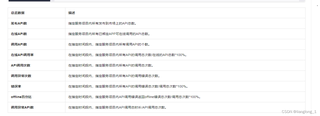
大致参数如下:

有没有好用的开源免费的适用于springboot项目的api监控服务啊。
大致参数如下:
 分享
分享
 关注
关注引自免费微信小程序:皆我百晓生
对于Spring Boot项目,有几个优秀的开源工具可以用于API监控,这些工具不仅能够提供详细的API调用信息,还能实现限流和告警功能。下面详细介绍几个推荐的解决方案:
Spring Cloud Sleuth 是一个分布式追踪库,它能够收集并记录微服务架构中的请求调用链路。结合 Zipkin 作为追踪服务器,可以可视化地展示API调用路径,以及每个API的响应时间等性能指标。
添加依赖:在pom.xml文件中添加Sleuth和Zipkin的依赖。
<dependency>
    <groupId>org.springframework.cloud</groupId>
    <artifactId>spring-cloud-sleuth</artifactId>
</dependency>
<dependency>
    <groupId>org.springframework.cloud</groupId>
    <artifactId>spring-cloud-starter-zipkin</artifactId>
</dependency>
配置Zipkin Server:如果需要自建Zipkin Server,可以参考官方文档。
配置应用:在application.yml或application.properties中添加Zipkin的配置。
spring:
  zipkin:
    base-url: http://localhost:9411
  sleuth:
    web:
      client:
        enabled: true
Spring Boot Actuator 提供了丰富的健康检查和监控端点,可以轻松获取应用程序的内部信息。结合 Prometheus 和 Grafana,可以实现对API的实时监控和可视化。
添加依赖:在pom.xml中添加Actuator和Prometheus客户端的依赖。
<dependency>
    <groupId>org.springframework.boot</groupId>
    <artifactId>spring-boot-starter-actuator</artifactId>
</dependency>
<dependency>
    <groupId>io.micrometer</groupId>
    <artifactId>micrometer-registry-prometheus</artifactId>
</dependency>
配置Actuator和Prometheus:在application.yml中添加配置。
management:
  endpoints:
    web:
      exposure:
        include: "*"
  endpoint:
    health:
      show-details: always
设置Prometheus抓取规则:配置Prometheus服务器以抓取Actuator提供的metrics。
Grafana配置:将Prometheus作为数据源,并创建仪表板来监控API调用情况。
Resilience4j 是一个轻量级的库,用于添加容错(例如重试、断路器、限流)到Java 8及更高版本的应用程序。它可以很好地与Spring Boot集成,提供API级别的限流和告警。
添加依赖:在pom.xml中添加Resilience4j的依赖。
<dependency>
    <groupId>io.github.resilience4j</groupId>
    <artifactId>resilience4j-spring-boot2</artifactId>
</dependency>
配置Resilience4j:在application.yml中添加限流策略。
resilience4j.ratelimiter:
  instances:
    myService:
      limitForPeriod: 10
      limitRefreshPeriod: 500
      timeoutDuration: 0
以上工具和框架都可以根据具体需求进行配置和调整,实现API监控、限流和告警功能。选择哪个工具主要取决于你的具体场景和对性能、易用性等方面的需求。
分享 销售项目流程化管理-销售项目流程化管理系统-销售项目流程化管理系统源码-销售项目流程化管理系统代码-springboot销售项目流程化管理系统源码-基于springboot的销售项目流程化管理系统设计
 创建了问题
6月14日
创建了问题
6月14日


