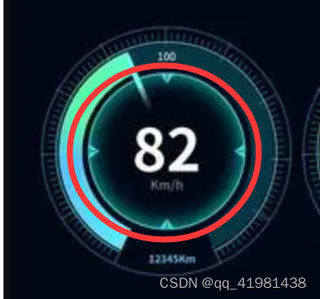
请问在echarts里怎么实现这张图红圈部分的带锯齿的圆环?

请问在echarts里怎么实现这张图红圈部分的带锯齿的圆环?
 分享
分享
// 获取图表
    initOptions(eventDataList) {
      const labelItemArr = [];
      for (let i = 0; i < 4; ++i) {
        // 可以根据循环的次数和value的大小调节齿轮样式
        labelItemArr.push(
          {
            value: 3,
            name: "",
            itemStyle: { normal: { color: "red" } },
          },
          {
            value: 30,
            name: "",
            itemStyle: {
              normal: {
                legend: {
                  show: false,
                },
                label: { show: false },
                labelLine: { show: false },
                color: "rgba(0, 0, 0, 0)", // 通过第二项设置颜色为透明制作齿轮效果
                borderColor: "rgba(0, 0, 0, 0)",
                borderWidth: 0,
              },
            },
          }
        );
      }
      this.options = {
        angleAxis: {
          clockwise: false, // 逆时针
          // 隐藏刻度线
          axisLine: {
            show: false,
          },
          axisTick: {
            show: false,
          },
          axisLabel: {
            show: false,
          },
          splitLine: {
            show: false,
          },
        },
        radiusAxis: {
          type: "category",
          // 隐藏刻度线
          axisLine: {
            show: false,
          },
          axisTick: {
            show: false,
          },
          axisLabel: {
            show: false,
          },
          splitLine: {
            show: false,
          },
        },
        polar: {
          center: ["50%", "50%"], // 图形位置
          radius: "140%", //图形大小
        },
        series: [
          {
            type: "pie",
            hoverAnimation: false,
            center: ["50%", "50%"],
            data: labelItemArr,
            radius: [15, 25], // 设置齿轮大小
            label: {
              normal: {
                position: "inside",
                show: false,
              },
            },
            tooltip: {
              show: false, // 取消悬浮框
            },
          },
          // 省略其他项
        ],
      };
      this.initCharts();
    },
    initCharts() {
      this.chart = echarts.init(document.getElementById("hotChart"));
      this.chart.setOption(this.options);
    },
 系统已结题
8月29日
系统已结题
8月29日 已采纳回答
8月21日
创建了问题
8月7日
已采纳回答
8月21日
创建了问题
8月7日


