
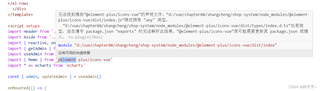
利用vue编写商城程序,连接前后端上述情况应怎样解决:消除引用前面的两个点,即正常引用
<template>
      <div class="common-layout">
    <el-container>
      <el-header>
        <Header></Header>
      </el-header>
      <el-container>
        <el-aside>
          <Aside></Aside>
        </el-aside>
        <el-main>
          <el-card class="box-card">
            <router-view></router-view>
          </el-card>
        </el-main>
      </el-container>
    </el-container>

    <el-row :gutter="20">
    <el-col :span="6">
      <el-card class="box-card">
        <template #header>
          <div class="card-header">
            <el-avatar class="avatar" :src="admin.avatar" shape="square" :size="40"> </el-avatar>
            <span style="font-size: 24px;">{{ admin.username }} </span>
          </div>
        </template>
        <div class="info">
          <p>登录时间:{{ loginInfo.loginTime }}</p>
          <p>登录地点:{{ loginInfo.loginPlace }}</p>
        </div>
      </el-card>
    </el-col>
    <!-- 单月统计信息展示 -->
    <el-col :span="18">
  <el-card class="box-card">
    <template #header>
      <div class="card-header">
        6月统计信息
      </div>
    </template>
    <div class="info">
      <el-row :gutter="24">
        <!-- 商品数量 -->
        <el-col :span="8">
          <div class="card-container">
            <div class="card-left-container" style="background-color: #EEAD0E;">
              <el-icon :size="90">
                <Memo />
              </el-icon>
            </div>
            <div class="card-right-container">
              <p class="number">500</p>
              <p>商品数量(个)</p>
            </div>
          </div>
        </el-col>
        <!-- 商品分类数量 -->
        <el-col :span="8">
          <div class="card-container">
            <div class="card-left-container" style="background-color: #AB82FF;">
                <el-icon :size="90">
                <Memo />
              </el-icon>
            </div>
            <div class="card-right-container">
              <p class="number">20</p>
              <p>商品分类数量(个)</p>
            </div>
          </div>
        </el-col>
        <!-- 用户访问次数 -->
        <el-col :span="8">
          <div class="card-container">
            <div class="card-left-container" style=" background-color: #63B8FF;">
              <el-icon :size="90">
                <Memo />
              </el-icon>
            </div>
            <div class="card-right-container">
              <p class="number">121</p>
              <p>用户访问次数(次)</p>
            </div>
          </div>
        </el-col>
      </el-row>
    </div>
  </el-card>
</el-col>
  </el-row>


  <!-- 图表区域 -->
  <el-row :gutter="20">
  <el-col :span="12">
    <!-- 通过折线图展示2022年月度销售额 -->
    <el-card class="box-card">
      <div id="salesVolume" style="width: auto; height:400px;"></div>
    </el-card>
  </el-col>
  <el-col :span="12">
    <!-- 通过柱状图展示2022年订单数量 -->
    <el-card class="box-card">
      <div id="orderQuantity" style="width: auto; height:400px;"></div>
    </el-card>
  </el-col>
</el-row>
  </div>
</template>

<script setup>
import Header from '../components/Header.vue'
import Aside from '../components/Aside.vue'
import { reactive, onMounted } from 'vue'
import { getAdmin } from '../../api'
import useAdmin from '../../stores/admin'
import { Memo } from '@element-plus/icons-vue'
import * as echarts from 'echarts'

const { admin, updateAdmin } = useAdmin()

onMounted(() => {
  loadAdmin()
  initCharts1()
  initCharts2()

})
// 图表1:月度销售额
const initCharts1 = () => {
  const myChart = echarts.init(document.getElementById('salesVolume'))
  myChart.setOption({
    color: ['#1493fa'],
    title: { text: '2022年月度销售额' },
    xAxis: {
      data: ['1月', '2月', '3月', '4月', '5月', '6月', '7月', '8月', '9月', '10月', '11月', '12月'],
      name: '月份',
      axisLabel: {
        interval: 0
      },
    },
    yAxis: {
      name: '单位(千万元)',
    },
    grid: {
      left: '3%',
      right: '8%',
      bottom: '5%',
      containLabel: true,
    },
    legend: {},
    series: [
      {
        data: [6, 7, 8.5, 8, 9, 10, 13, 12, 10, 16, 15, 14],
        type: 'line',
        name: '销售额',
        smooth: true,
        label: {
          show: true,
          position: 'top',
        }
      }
    ]
  })
  // 图表自适应大小
  window.onresize = () => {
    myChart.resize()
  }
}


// 图表2:2022年订单数量
const initCharts2 = () => {
  const myChart = echarts.init(document.getElementById('orderQuantity'))
  myChart.setOption({
    title: { text: '2022年订单数量' },
    color: ['#1493fa'],
    grid: {
      left: '3%',
      right: '8%',
      bottom: '3%',
      containLabel: true,
    },
    xAxis: {
      type: 'category',
      data: ['1月', '2月', '3月', '4月', '5月', '6月', '7月', '8月', '9月', '10月', '11月', '12月'],
      name: '月份',
      // 类目轴中在 boundaryGap 为 true 的时候有效,可以保证刻度线和标签对齐
      axisTick: {
        alignWithLabel: true,
      },
      axisLabel: {
        interval: 0,rotate: 45 // 设置刻度标签旋转角度为45度
      },
    },
    legend: {},
    yAxis: {
      name: '单位(个)',
    },
    series: [
      {
        data: [400, 450, 300, 230, 250, 300, 400, 350, 160, 350, 380, 400],
        type: 'bar',
        barWidth: '60%',
        name: '订单总数',
        label: {
          show: true,
          position: 'top',
        }
      }
    ]
  })
  // 图表自适应大小
  window.onresize = () => {
    myChart.resize()
  }
}

const loadAdmin = async () => {
  let data = await getAdmin()
  updateAdmin({
    username: data.username,
    avatar: data.avatar
  })
}

// 用户登录信息(模拟数据)
const loginInfo = reactive({
  loginTime: '2023-07-22 09:00:00',
  loginPlace: '北京'
})

</script>

<style lang="scss" scoped>
.el-container {
  height: 100%;
  .el-header {
    background: -webkit-gradient(linear, left top, right top, from(#1493fa), to(#01c6fa));
    text-align: center;
    line-height: 60px;
    color: #333;
  }
  .el-aside {
    width: 200px;
    height: 100%;
    color: #333;
    background: white
  }
  .el-main {
    height: 100vh;
    background-color: #e9eef3;
    color: #333;
  }
  .el-row {
  margin-bottom: 20px;
  &:last-child {
    margin-bottom: 0;
  }
  .el-col {
    .box-card {
      .card-header {
        display: flex;
        justify-content: space-between;
        align-items: center;
      }
      .info {
        font-size: 14px;
      }
}
}
  }
  .card-container {
  display: flex;
  align-items: center;
  justify-content: space-between;
  border: 1px solid #e4e7ed;
  text-align: center;
}
  padding-right: 20px;
  .card-left-container {
    color: white;
  }
  .card-right-container {
    .number {
      font-size: 18px;
      font-weight: bold;
    }
  }
}
</style>


