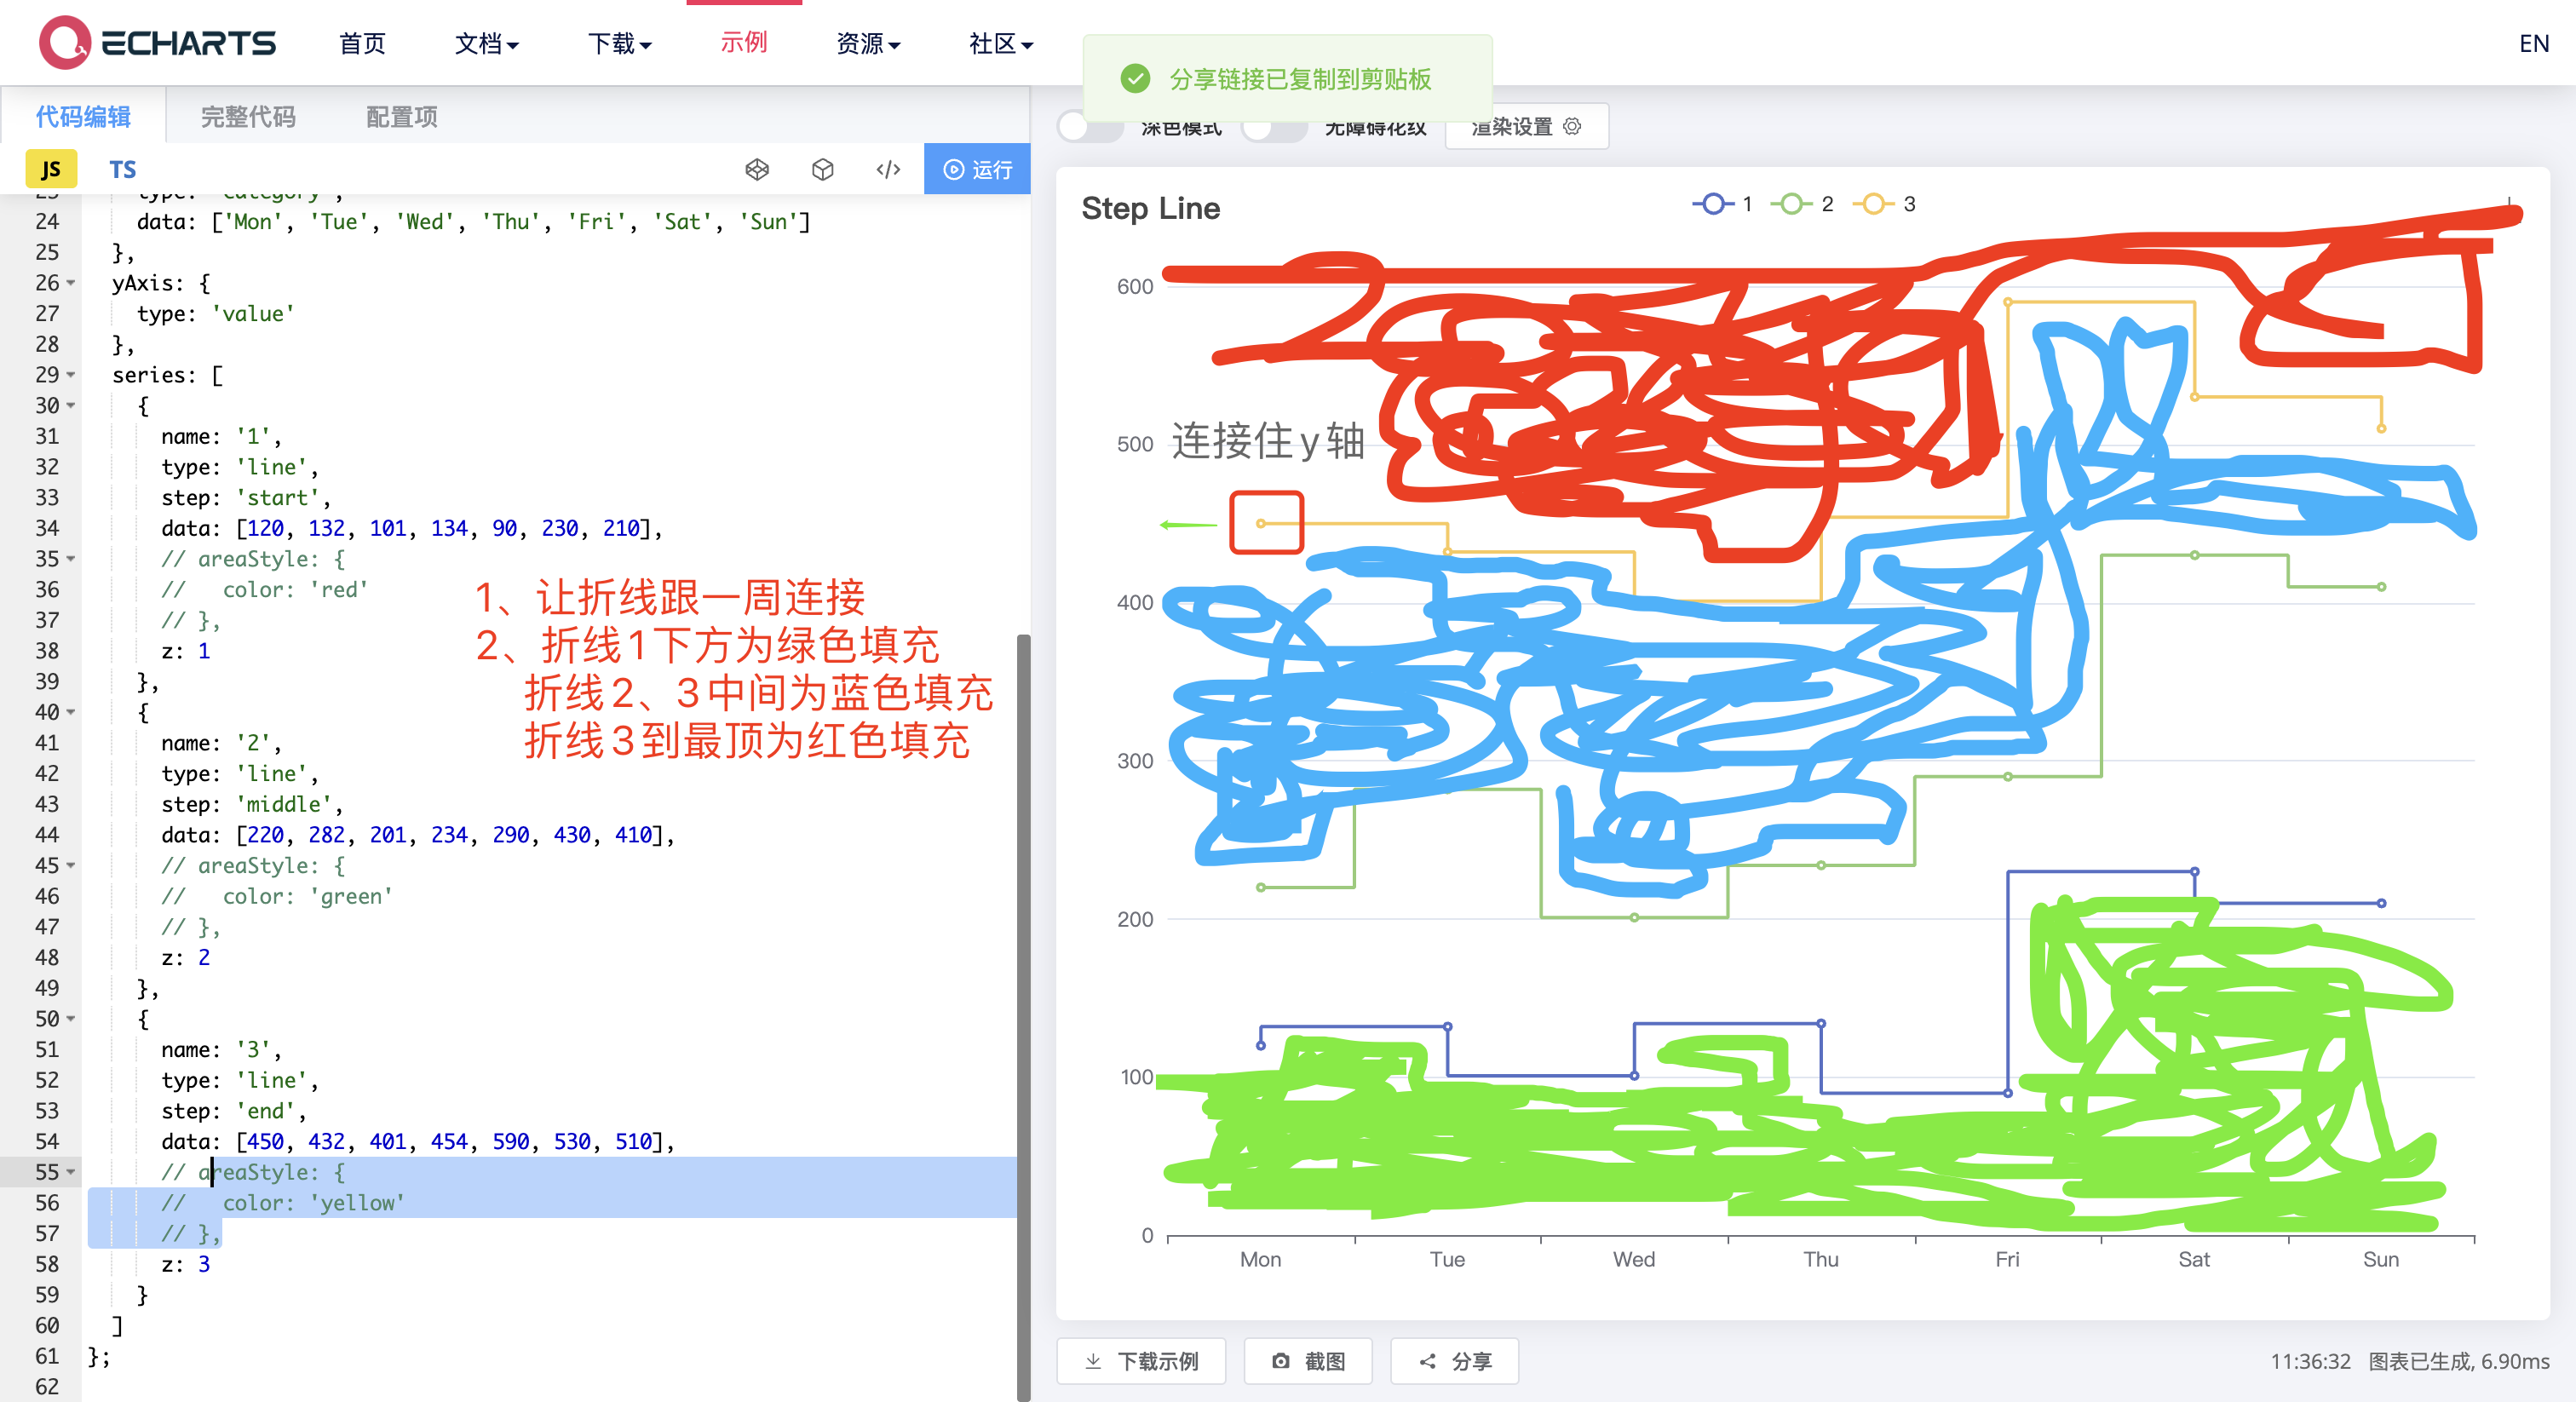
echarts 阶梯折线图,增加线之间的填充,还有阶梯折线图起点连线问题

 分享
分享
阿里嘎多学长整理AIGC生成,因移动端显示问题导致当前答案未能完全显示,请使用PC端查看更加详细的解答过程
你想在 echarts 中创建一个阶梯折线图,并且增加线之间的填充,还有起点连线的问题。
echarts 提供了多种类型的图表,包括折线图、柱状图、饼图等。阶梯折线图可以使用 stepLine option 创建。
增加线之间的填充,可以使用 area option 创建一个区域填充图。
起点连线,可以使用 connectNulls option 设置为 true。
下面是一个简单的示例代码:
import { LineChart, StepLine, Area } from 'echarts/charts';
import { Grid } from 'echarts/components';
import { Title, Legend } from 'echarts/components';

const chart = new LineChart(document.getElementById('chart'));
chart.setOption({
  title: '阶梯折线图',
  legend: {
    data: ['线1', '线2']
  },
  grid: {
    left: '3%',
    right: '4%',
    bottom: '3%',
    containLabel: true
  },
  xAxis: {
    type: 'category',
    data: ['Mon', 'Tue', 'Wed', 'Thu', 'Fri', 'Sat', 'Sun']
  },
  yAxis: {
    type: 'value'
  },
  series: [
    {
      name: '线1',
      type: 'stepLine',
      data: [10, 20, 30, 40, 50, 60, 70],
      areaStyle: {
        normal: {
          color: new echarts.graphic.LinearGradient(0, 0, 0, 1, [
            {
              offset: 0,
              color: 'rgba(255, 0, 0, 0.2)'
            },
            {
              offset: 1,
              color: 'rgba(255, 0, 0, 0)'
            }
          ])
        }
      }
    },
    {
      name: '线2',
      type: 'stepLine',
      data: [15, 25, 35, 45, 55, 65, 75],
      areaStyle: {
        normal: {
          color: new echarts.graphic.LinearGradient(0, 0, 0, 1, [
            {
              offset: 0,
              color: 'rgba(0, 255, 0, 0.2)'
            },
            {
              offset: 1,
              color: 'rgba(0, 255, 0, 0)'
            }
          ])
        }
      }
    }
  ],
  connectNulls: true
});
这个示例代码创建了一个阶梯折线图,并且增加了线之间的填充。起点连线也被设置为 true。
分享 创建了问题
4月25日
创建了问题
4月25日


