

我从官网上下载中国区的GPM半小时降水数据, nc格式。现使用python代码从nc数据中提取precipitation变量为tif数据,后面发现两个问题
1.用ArcMap查看方向是正确的,但用envi打开就会发生偏转。
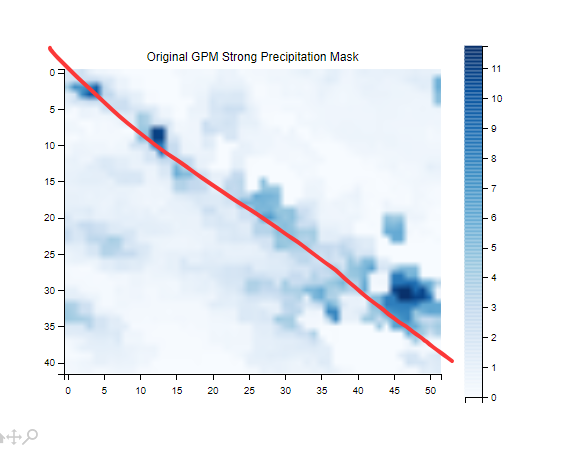
2.我研究用python代码标出GPM中的降水位置,输入的是上面生成的正确的GPM.tif,但生成的可视化图还是翻转的原图降水区域明明集中在是左下角和右上角对角线
图一是原栅格图 很明显降水集中在左下角到右上角的对角线
图二是可视化栅格降水信息 降水集中到了左上角到右下角的对角线

下面是我用的代码:
import rasterio
import numpy as np
import matplotlib.pyplot as plt

# 1. 加载GPM数据
gpm_file = r"E:\XC\GPMjz_tif\3B-HHR.MS.MRG.3IMERG.20220515-S110000-E112959.0660.V07B.HDF5_clipped_precipitation_data.tif"
with rasterio.open(gpm_file) as gpm_src:
    gpm_data = gpm_src.read(1)  # 读取GPM数据
    gpm_meta = gpm_src.meta  # 获取GPM的元数据
    print("GPM Meta:", gpm_meta)  # 打印元数据,检查仿射变换矩阵

# 显示仿射变换矩阵
print("Affine Transform:", gpm_meta['transform'])

# 仿射变换矩阵一般是一个 3x2 矩阵:
# | a | b | x0 |
# | c | d | y0 |
# 其中:
# a, c = X轴方向的分辨率和旋转角度
# b, d = Y轴方向的分辨率和旋转角度
# x0, y0 = 参考点的原始坐标

# 2. 可视化原始GPM强降水区域
plt.imshow(gpm_data, cmap='Blues')
plt.title('Original GPM Strong Precipitation Mask')
plt.colorbar()
plt.show()
输出:
E:\AnacondaEnvs\XCpython\python.exe E:\project\pythonProject\对齐\经纬度顺序.py
GPM Meta: {'driver': 'GTiff', 'dtype': 'float32', 'nodata': -9999.900390625, 'width': 52, 'height': 42, 'count': 1, 'crs': CRS.from_wkt('GEOGCS["WGS 84",DATUM["WGS_1984",SPHEROID["WGS 84",6378137,298.257223563,AUTHORITY["EPSG","7030"]],AUTHORITY["EPSG","6326"]],PRIMEM["Greenwich",0,AUTHORITY["EPSG","8901"]],UNIT["degree",0.0174532925199433,AUTHORITY["EPSG","9122"]],AXIS["Latitude",NORTH],AXIS["Longitude",EAST],AUTHORITY["EPSG","4326"]]'), 'transform': Affine(0.09999997008080576, 0.0, 117.99999543732288,
       0.0, 0.10000000930413967, 26.999999232408477)}
Affine Transform: | 0.10, 0.00, 118.00|
| 0.00, 0.10, 27.00|
| 0.00, 0.00, 1.00|

进程已结束,退出代码为 0


