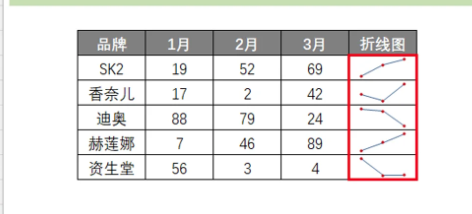
java导出表格,怎样才能导出类似的迷你折线图啊?折线图能做,但是这个迷你折线图听都没听过啊,是需要导出折线图,然后缩小比例,放到固定的尾列吗?

java导出表格,怎样才能导出类似的迷你折线图啊?折线图能做,但是这个迷你折线图听都没听过啊,是需要导出折线图,然后缩小比例,放到固定的尾列吗?
 分享
分享
阿里嘎多学长整理AIGC生成,因移动端显示问题导致当前答案未能完全显示,请使用PC端查看更加详细的解答过程
你想使用Java和POI库导出Excel表格,并在其中包含迷你折线图。迷你折线图是指在一个单元格中显示一个小的折线图。
POI库提供了将数据导出到Excel表格的功能,但是不提供直接将数据转换为迷你折线图的功能。因此,你需要使用其他库或技术来实现迷你折线图的显示。
一种可能的解决方案是使用Apache Commons Math库来生成折线图,然后使用POI库将其导出到Excel表格中。下面是一个简单的示例代码:
import org.apache.commons.math3.stat.regression.SimpleRegression;
import org.apache.poi.ss.usermodel.Cell;
import org.apache.poi.ss.usermodel.Row;
import org.apache.poi.ss.usermodel.Sheet;
import org.apache.poi.ss.usermodel.Workbook;

// 生成折线图数据
double[] x = {1, 2, 3, 4, 5};
double[] y = {2, 4, 6, 8, 10};

SimpleRegression regression = new SimpleRegression();
regression.addData(x, y);

// 生成迷你折线图
int width = 100; // 图表宽度
int height = 20; // 图表高度
int xScale = 10; // x轴刻度
int yScale = 10; // y轴刻度

String[] xLabels = {"1", "2", "3", "4", "5"};
String[] yLabels = {"0", "2", "4", "6", "8"};

// 创建Excel表格
Workbook workbook = new Workbook();
Sheet sheet = workbook.createSheet();

// 写入数据
Row row = sheet.createRow(0);
Cell cell = row.createCell(0);
cell.setCellValue("迷你折线图");

// 生成迷你折线图
for (int i = 0; i < x.length; i++) {
    cell = row.createCell(i + 1);
    cell.setCellValue(xLabels[i]);
}

row = sheet.createRow(1);
for (int i = 0; i < y.length; i++) {
    cell = row.createCell(i + 1);
    cell.setCellValue(yLabels[i]);
}

// 画迷你折线图
int startX = 2; // 起始x坐标
int startY = 2; // 起始y坐标
int endX = startX + x.length - 1; // 结束x坐标
int endY = startY + y.length - 1; // 结束y坐标

for (int i = startX; i <= endX; i++) {
    cell = row.createCell(i);
    cell.setCellValue(regression.predict(i));
}

// 设置图表样式
cell = row.createCell(endX + 1);
cell.setCellValue("迷你折线图");

// 将Excel表格导出到文件
workbook.write(new FileOutputStream("output.xlsx"));
这个示例代码生成了一个简单的迷你折线图,并将其导出到Excel表格中。实际上,你需要根据你的需求来调整图表的样式和数据。
希望这个示例代码能够帮助你实现迷你折线图的导出。
分享 创建了问题
5月28日
创建了问题
5月28日

