
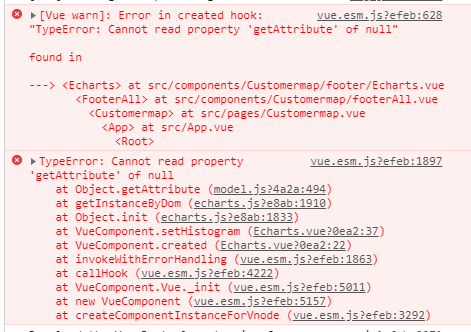
created(){
for(let i in this.columnar){
this.Xdata.push(this.columnar[i].itemName)
this.ydata.push(this.columnar[i].deviceNum)
}
this.setHistogram()
},
mounted(){
window.addEventListener('resize',()=>{
this.myEcharts.resize()
})
this.setHistogram()
},
setHistogram(){
this.myEcharts = this.$echarts.init(document.getElementById('myEcharts'))
// window.onresize = myEcharts.resize;
let option = {
title:{
text:'设备区域分布',
left:'center',
top:20,
},
legend: {
data:['设备数量'],
// left:'right',
right:60,
top:150
},
tooltip:{
trigger: 'axis',
axisPointer : {
type : 'shadow'
}
},
xAxis : [
{
type : 'category',
data : this.Xdata
}
],
yAxis : [
{
type : 'value'
}
],
series : [
{
name:'设备数量',
type:'bar',
data:this.ydata
}
]
}
this.myEcharts.setOption(option,true)
},


