
利用echarts Les Miserables的例子绘制了一个关系图,现在想根据边的权重设置边的粗细
<%@ page language="java" contentType="text/html; charset=utf-8"
    pageEncoding="utf-8"%>
<!DOCTYPE html>
<html>
<head>
    <meta charset="utf-8">
    <title>ECharts</title>
    <!-- 引入 echarts.js -->
     <script type="text/javascript" src="../js/jquery.min.js"></script>
     <script type="text/javascript" src="../js/jquery.js"></script>
        <script type="text/javascript" src="../js/echarts.min.js"></script>
          <script type="text/javascript" src="../js/dataTool.js"></script>
</head>
<body style="height: 600px; margin: 0">
<div id="container" style="height: 100%"></div>
<script type="text/javascript">
    var dom = document.getElementById("container");
    var myChart = echarts.init(dom);
    var app = {};
    option = null;
    myChart.showLoading();
    $.get('../data/1.gexf', function (xml) {
        myChart.hideLoading();
        var graph = echarts.dataTool.gexf.parse(xml);
        console.log(JSON.stringify(graph));
        var categories = [];
        for (var i = 0; i < 9; i++) {
            categories[i] = {
                name: '类目' + i
            };
        }
        graph.nodes.forEach(function (node) {
            node.itemStyle = null;
            node.value = node.symbolSize;
            node.symbolSize /= 1.5;
            node.label = {
                normal: {
                    show: node.symbolSize > 1
                }
            };
            node.category = node.attributes.modularity_class;
        }
        );


         option = {
            title: {
                text: 'Les Miserables',
                subtext: 'Circular layout',
                top: 'bottom',
                left: 'right'
            },
            tooltip: {},
            legend: [{
                // selectedMode: 'single',
                data: categories.map(function (a) {
                    return a.name;
                })
            }],
            animationDurationUpdate: 1500,
            animationEasingUpdate: 'quinticInOut',
            series : [
                {
                    name: 'Les Miserables',
                    type: 'graph',
                    layout: 'circular',
                    circular: {
                        rotateLabel: true
                    },
                    data: graph.nodes,
                    links: graph.links,
                    categories: categories,
                    roam: true,
                    label: {
                        normal: {
                            position: 'right',
                            formatter: '{b}'
                        }
                    },
                    edgeSymbol : [ 'none', 'arrow' ],
                    lineStyle: {
                        normal: {
                            color: 'source',
                            curveness: 0.3,

                        }
                    }
                }
            ]
        };

        myChart.setOption(option);
    }, 'xml');
    if (option && typeof option === "object") {
        var startTime = +new Date();
        myChart.setOption(option, true);
        var endTime = +new Date();
        var updateTime = endTime - startTime;
        console.log("Time used:", updateTime);
    }
</script>
</body>
</html>
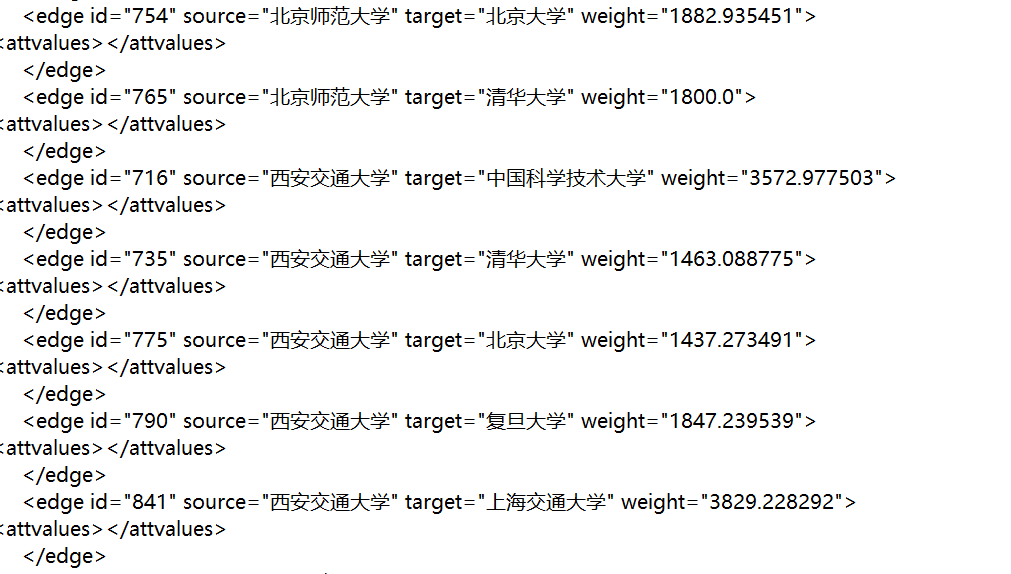
gexf文件的内容为
运行效果为


