使用leaflet-tilelayer-colorizr.js调用瓦片时候提示跨域
1,leaflet-tilelayer-colorizr.js代码如下
/*
 * L.TileLayer.Colorizr is a regular tilelayer with mapped colors.

 */

 (function() {


    // L.TileLayer.Colorizr =
    var Colorizr = L.TileLayer.extend({

        initialize: function (url, options) {
            options = L.extend({}, L.TileLayer.prototype.options, {
                colorize: function(pixel) {
                    return pixel;
                },
                crossOrigin: "Anonymous"
            }, options);
            L.TileLayer.prototype.initialize.call(this, url, options);
            L.setOptions(this, options);

            this.setColorizr(this.options.colorize);

            this.on('tileload', function(e) {
                this._colorize(e.tile);
            });
        },

        setColorizr: function(colorizrFactory) {
            if(!colorizrFactory || typeof colorizrFactory !== 'function') {
                throw 'The colorize option should be a function and return an object with at least one of "r", "g", "b", or "a" properties. Got:' +
                    typeof colorizrFactory;
            }
            else {
                this.options.colorize = colorizrFactory;
            }

            this.redraw(true);
        },

        _createTile: function () {
            var tile = L.TileLayer.prototype._createTile.call(this);
            tile.crossOrigin = "Anonymous";
            return tile;
        },

        _colorize: function (img) {
            if (img.getAttribute('data-colorized'))
                return;

            img.crossOrigin = 'Anonymous';
            var canvas = document.createElement("canvas");
            canvas.width = img.width;
            canvas.height = img.height;
            var ctx = canvas.getContext("2d");
            ctx.drawImage(img, 0, 0);

            var imgd = ctx.getImageData(0, 0, canvas.width, canvas.height);
            var pix = imgd.data;

            for (var i = 0, n = pix.length; i < n; i += 4) {

                // iterate through the pixels

                var pixel = this.options.colorize({r: pix[i], g: pix[i+1], b: pix[i+2], a: pix[i+3]});

                if(!!!pixel || pixel !== Object(pixel) || Object.prototype.toString.call(pixel) === '[object Array]') {

                    if(i === 0) {
                        throw 'The colorize option should return an object with at least one of "r", "g", "b", or "a" properties.';
                    }

                } else {

                    if(pixel.hasOwnProperty('r') && typeof pixel.r === 'number') {
                        pix[i] = pixel.r;
                    }
                    if(pixel.hasOwnProperty('g')) {
                        pix[i+1] = pixel.g;
                    }
                    if(pixel.hasOwnProperty('b')) {
                        pix[i+2] = pixel.b;
                    }
                    if(pixel.hasOwnProperty('a')) {
                        pix[i+3] = pixel.a;
                    }
                }

            }

            ctx.putImageData(imgd, 0, 0);
            img.setAttribute('data-colorized', true);
            img.src = canvas.toDataURL();
        }
    });

    (function (factory, window) {

        // define an AMD module that relies on 'leaflet'
        if (typeof define === 'function' && define.amd) {
            define(['leaflet'], factory);

        // define a Common JS module that relies on 'leaflet'
        } else if (typeof exports === 'object') {
            module.exports = factory(require('leaflet'));
        }

        // attach your plugin to the global 'L' variable
        if (typeof window !== 'undefined' && window.L) {
            window.L.tileLayer.colorizr = factory(L);
        }
    }(function (L) {
        return function(url, options) {
            return new Colorizr(url, options);
        };
    }, window));


 })()
2,页面调用使用如下:
<script>
var map = L.map('map', {
zoominfoControl: true,
zoomControl: false,
//zoom: 5,
//center: [31.22, 121.48],
attributionControl: true
}).setView([23.3725, 116.4238], 5);
//var map = L.map('map').setView([23.1291, 113.2644], 13);
L.tileLayer.colorizr('gmaps/{z}/{x}/{y}.png', {
maxZoom: 15,
attribution: 'Map data © GoogleMap,Support by <a href="http://rovertang.com/">RoverTang</a>'
}).addTo(map);
var marker = L.marker([22.7457, 113.9454]).addTo(map)
.bindPopup("这是一个标注点")
.openPopup();
var marker = L.marker([35.86, 99.66]).addTo(map)
.bindPopup("这是二个标注点")
.openPopup();
</script>
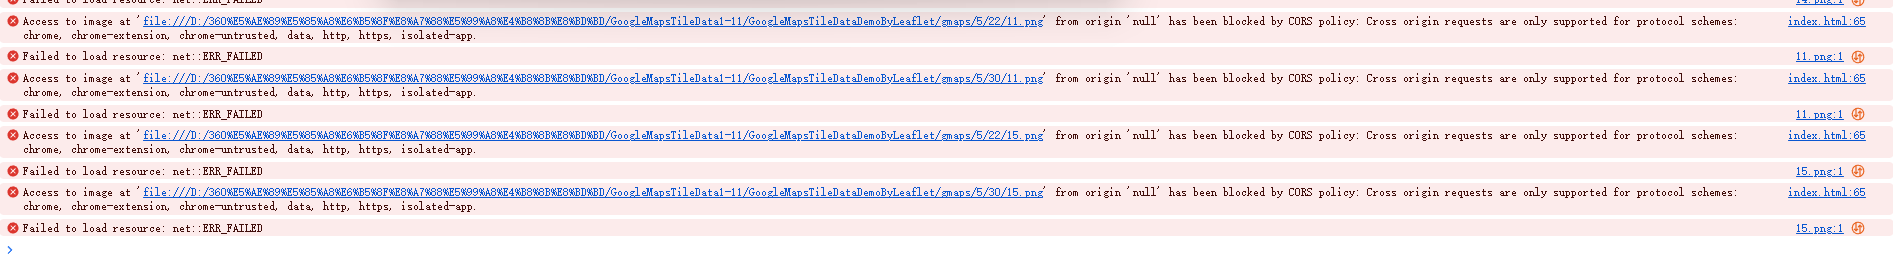
3,报错如下