
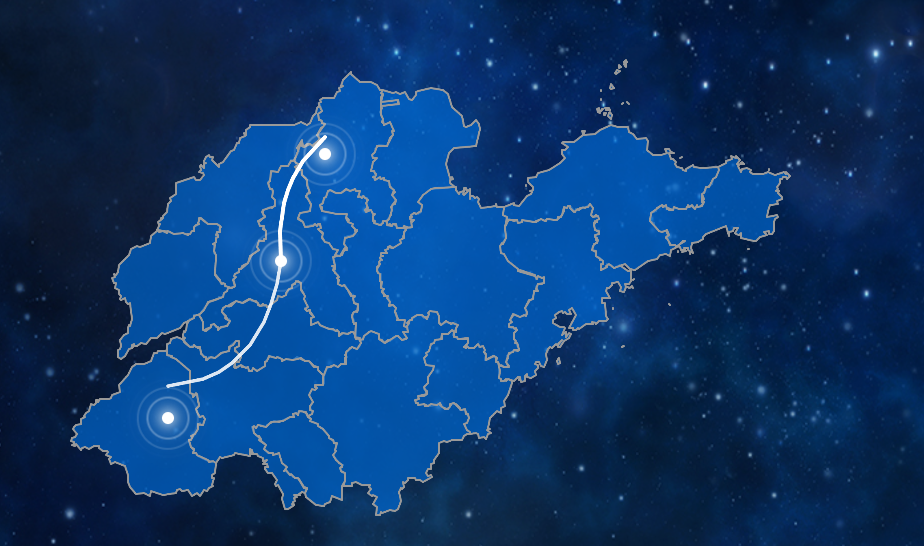
如何解决地图内弧线涟漪点位置不重合。正常显示偏差大,放大时偏差较小
<script>
// 更新时间显示函数
function updateTime() {
const now = new Date();
const year = now.getFullYear();
const month = String(now.getMonth() + 1).padStart(2, '0');
const day = String(now.getDate()).padStart(2, '0');
const hours = String(now.getHours()).padStart(2, '0');
const minutes = String(now.getMinutes()).padStart(2, '0');
const seconds = String(now.getSeconds()).padStart(2, '0');
const timeString = `${year}-${month}-${day} ${hours}:${minutes}:${seconds}`;
document.getElementById('current-time').textContent = timeString;
}
// 页面加载完成后执行
document.addEventListener('DOMContentLoaded', function() {
// 立即更新一次时间
updateTime();
// 每秒更新一次时间
setInterval(updateTime, 1000);
// 初始化地图和加载数据
initMapAndLoadData();
});
// 1. 初始化Leaflet地图
let map = L.map('leaflet-map-container').setView([36.5470, 118.0819], 7);
let shandongLayer = null;
// 连接线相关变量
let jinanToBinzhouLine = null;
let jinanToHezeLine = null;
let jinanMarker = null;
let binzhouMarker = null;
let hezeMarker = null;
// 3. 山东省各城市的中心坐标
const shandongCities = {
"济南市": [36.6512, 117.1201],
"青岛市": [36.0667, 120.3826],
"淄博市": [36.8135, 118.0549],
"枣庄市": [34.8105, 117.3238],
"东营市": [37.4335, 118.6746],
"烟台市": [37.4638, 121.4479],
"潍坊市": [36.7069, 119.1617],
"济宁市": [35.4149, 116.5872],
"泰安市": [36.2001, 117.0863],
"威海市": [37.5133, 122.1215],
"日照市": [35.4169, 119.5266],
"临沂市": [35.1047, 118.3565],
"德州市": [37.4341, 116.3575],
"聊城市": [36.4567, 115.9854],
"滨州市": [37.7401, 117.6140],
"菏泽市": [35.5433, 115.8807]
};
// 初始化地图和加载数据
function initMapAndLoadData() {
// 延迟加载,确保页面完全渲染
setTimeout(() => {
tryLoadLocalFile();
}, 500);
}
// 4. 创建简单的地理JSON数据(如果本地文件加载失败)
function createSimpleShandongGeoJSON() {
const geojson = {
"type": "FeatureCollection",
"features": []
};
// 为每个城市创建一个简单的点特征
Object.keys(shandongCities).forEach(cityName => {
const coords = shandongCities[cityName];
geojson.features.push({
"type": "Feature",
"properties": {
"name": cityName,
"center": coords
},
"geometry": {
"type": "Point",
"coordinates": [coords[1], coords[0]]
}
});
});
return geojson;
}
// 5. 创建山东省的简化边界
function createShandongOutline() {
// 山东省的简化边界坐标
const shandongOutline = [
[38.5, 117.5],
[38.0, 118.5],
[37.5, 120.0],
[37.0, 120.5],
[36.5, 121.5],
[36.0, 122.5],
[35.5, 119.5],
[35.0, 118.5],
[34.5, 116.0],
[35.0, 115.0],
[36.0, 116.0],
[37.0, 115.5],
[37.5, 116.5],
[38.5, 117.5]
];
return {
"type": "FeatureCollection",
"features": [{
"type": "Feature",
"properties": {
"name": "山东省",
"type": "outline"
},
"geometry": {
"type": "Polygon",
"coordinates": [shandongOutline.map(coord => [coord[1], coord[0]])]
}
}]
};
}
// 6. 尝试从在线来源加载数据
function loadFromOnlineSource() {
console.log("尝试从在线来源加载山东省数据...");
// 在线GeoJSON数据源(备用)
const onlineSources = [
"https://geo.datav.aliyun.com/areas_v3/bound/370000_full.json",
"https://raw.githubusercontent.com/longwosion/geojson/master/shandong.json"
];
let currentSourceIndex = 0;
function tryNextSource() {
if (currentSourceIndex >= onlineSources.length) {
console.log("所有在线源都失败了,使用简化数据");
loadSimplifiedData();
return;
}
const sourceUrl = onlineSources[currentSourceIndex];
console.log(`尝试源 ${currentSourceIndex + 1}: ${sourceUrl}`);
fetch(sourceUrl)
.then(response => {
if (!response.ok) throw new Error(`HTTP ${response.status}`);
return response.json();
})
.then(data => {
console.log(`从在线源 ${currentSourceIndex + 1} 加载成功`);
updateStatus(`在线源 ${currentSourceIndex + 1}`, data.features ? data.features.length : '未知');
loadGeoJSONData(data, `在线源 ${currentSourceIndex + 1}`);
})
.catch(error => {
console.log(`在线源 ${currentSourceIndex + 1} 失败:`, error.message);
currentSourceIndex++;
tryNextSource();
});
}
tryNextSource();
}
// 7. 加载简化数据(兜底方案)
function loadSimplifiedData() {
console.log("加载简化山东省数据...");
const simpleData = createSimpleShandongGeoJSON();
updateStatus("简化数据", Object.keys(shandongCities).length);
loadGeoJSONData(simpleData, "简化数据");
// 添加省界轮廓
const outlineData = createShandongOutline();
L.geoJSON(outlineData, {
style: {
fillColor: '#0066CC',
color: '#999999',
weight: 2,
fillOpacity: 0.7
}
}).addTo(map);
// 为每个城市添加标记
Object.keys(shandongCities).forEach(cityName => {
const coords = shandongCities[cityName];
L.marker(coords)
.bindPopup(`<b>${cityName}</b><br>山东省地级市`)
.addTo(map);
});
}
// 8. 尝试加载本地文件
function tryLoadLocalFile() {
const filePath = './js/SD.json';
console.log(`尝试加载本地文件: ${filePath}`);
updateStatus("本地文件", "--");
fetch(filePath)
.then(response => {
if (!response.ok) {
throw new Error(`HTTP错误! 状态: ${response.status}`);
}
return response.json();
})
.then(data => {
console.log("本地文件加载成功");
updateStatus("本地文件", data.features ? data.features.length : '未知');
loadGeoJSONData(data, "本地文件");
})
.catch(error => {
console.error("本地文件加载失败:", error);
updateStatus("本地文件失败", error.message);
// 尝试在线源
setTimeout(() => {
document.getElementById('map-loading').innerHTML +=
`<div class="error-message">本地文件加载失败,尝试在线源...</div>`;
loadFromOnlineSource();
}, 1000);
});
}
// 9. 更新状态显示
function updateStatus(source, count) {
document.getElementById('load-status').textContent = '加载成功';
document.getElementById('city-count').textContent = count;
document.getElementById('data-source').textContent = source;
}
// 10. 加载并显示GeoJSON数据
function loadGeoJSONData(geoJSON, sourceName) {
// 隐藏加载提示
document.getElementById('map-loading').style.display = 'none';
// 如果已有图层,先移除
if (shandongLayer) {
map.removeLayer(shandongLayer);
}
// 核心:统一所有区域的样式
function getUnifiedStyle() {
return {
fillColor: '#0066CC',
weight: 2,
opacity: 1,
color: '#999999',
dashArray: '0',
fillOpacity: 0.7
};
}
// 创建新的图层(应用统一样式)
shandongLayer = L.geoJSON(geoJSON, {
style: getUnifiedStyle,
onEachFeature: function(feature, layer) {
const cityName = feature.properties.name || '未知地区';
layer.on({
mouseover: function(e) {
e.target.setStyle({
weight: 2,
color: '#FFFFFF',
fillOpacity: 0.9
});
},
mouseout: function(e) {
shandongLayer.resetStyle(e.target);
},
click: function(e) {
map.fitBounds(e.target.getBounds());
let popupContent = `
<div style="font-weight:bold;color:#00aaff;margin-bottom:8px;font-size:16px;">
${cityName}
</div>
<div style="margin:5px 0;color:#c0d8ff;">
数据源: ${sourceName}
</div>
<div style="margin-top:10px;padding-top:8px;border-top:1px solid rgba(255,255,255,0.2);">
<small style="color:#c0d8ff;"></small>
</div>
`;
layer.bindPopup(popupContent, {
className: 'custom-popup',
maxWidth: 300
}).openPopup();
}
});
}
}).addTo(map);
// 自动缩放到数据范围
if (geoJSON.features && geoJSON.features.length > 0) {
map.fitBounds(shandongLayer.getBounds());
// 监听地图移动结束事件,且只监听一次
map.once('moveend', function() {
addAllConnections();
});
} else {
addAllConnections();
}
// 添加所有连接线
setTimeout(addAllConnections, 300);
}
// 11. 控制函数
function resetView() {
map.setView([36.5470, 118.0819], 7);
}
function zoomToShandong() {
if (shandongLayer) {
map.fitBounds(shandongLayer.getBounds());
} else {
map.fitBounds([[34.5, 114.5], [38.5, 123.0]]);
}
}
// 12. 窗口自适应
window.addEventListener('resize', () => {
map.invalidateSize();
if (shandongLayer) { // 确保图层已加载
updateJinanToBinzhouLine();
updateJinanToHezeLine();
}
});
// 14. 弧线相关函数
function calculateArcPoints(startCoords, endCoords, curveHeight = 0.3) {
if (!startCoords || !endCoords) {
console.warn("计算弧线点失败:坐标无效");
return [startCoords || [36.5470, 118.0819], endCoords || [36.5470, 118.0819]];
}
const [lat1, lng1] = startCoords;
const [lat2, lng2] = endCoords;
// 计算中间点
const midLat = (lat1 + lat2) / 2;
const midLng = (lng1 + lng2) / 2;
// 计算距离用于确定弧线高度
const latDiff = lat2 - lat1;
const lngDiff = lng2 - lng1;
// 计算控制点
const controlLat = midLat + (lngDiff * curveHeight);
const controlLng = midLng - (latDiff * curveHeight);
// 使用二次贝塞尔曲线生成弧线点
const points = [];
const steps = 20;
for (let i = 0; i <= steps; i++) {
const t = i / steps;
const lat = Math.pow(1 - t, 2) * lat1 +
2 * (1 - t) * t * controlLat +
Math.pow(t, 2) * lat2;
const lng = Math.pow(1 - t, 2) * lng1 +
2 * (1 - t) * t * controlLng +
Math.pow(t, 2) * lng2;
points.push([lat, lng]);
}
return points;
}
// 创建涟漪点图标
function createRippleIcon(size = 30, color = '#ffffff') {
return L.divIcon({
className: 'ripple-marker',
html: `
<div class="ripple-inner" style="background-color: ${color}; box-shadow: 0 0 10px 3px ${color}80;"></div>
<div class="ripple-wave" style="border-color: ${color}80;"></div>
<div class="ripple-wave" style="border-color: ${color}80;"></div>
<div class="ripple-wave" style="border-color: ${color}80;"></div>
`,
iconSize: [size, size],
iconAnchor: [size/2, size/2]
});
}
// 强制更新涟漪点位置
function updateRippleMarkersPosition() {
const jinanCoords = shandongCities["济南市"];
const binzhouCoords = shandongCities["滨州市"];
const hezeCoords = shandongCities["菏泽市"];
if (jinanMarker) {
jinanMarker.setLatLng(jinanCoords);
}
if (binzhouMarker) {
binzhouMarker.setLatLng(binzhouCoords);
}
if (hezeMarker) {
hezeMarker.setLatLng(hezeCoords);
}
}
// 初始化所有涟漪点标记
function initConnectionMarkers() {
console.log("初始化涟漪点...");
const jinanCoords = shandongCities["济南市"];
const binzhouCoords = shandongCities["滨州市"];
const hezeCoords = shandongCities["菏泽市"];
// 删除已有的端点标记
if (jinanMarker) map.removeLayer(jinanMarker);
if (binzhouMarker) map.removeLayer(binzhouMarker);
if (hezeMarker) map.removeLayer(hezeMarker);
// 济南涟漪点
jinanMarker = L.marker(jinanCoords, {
icon: createRippleIcon(35, '#ffffff'),
interactive: true
}).addTo(map);
// 滨州涟漪点
binzhouMarker = L.marker(binzhouCoords, {
icon: createRippleIcon(30, '#ffffff'),
interactive: true
}).addTo(map);
// 菏泽涟漪点
hezeMarker = L.marker(hezeCoords, {
icon: createRippleIcon(30, '#ffffff'),
interactive: true
}).addTo(map);
// 为涟漪点添加交互效果
setupRippleInteractions();
}
// 设置涟漪点交互效果
function setupRippleInteractions() {
// 济南涟漪点交互
jinanMarker.on('mouseover', function() {
this.getElement().style.filter = 'brightness(1.5) drop-shadow(0 0 15px rgba(255, 255, 255, 0.9))';
});
jinanMarker.on('mouseout', function() {
this.getElement().style.filter = 'brightness(1) drop-shadow(0 0 10px rgba(255, 255, 255, 0.8))';
});
// 滨州涟漪点交互
binzhouMarker.on('mouseover', function() {
this.getElement().style.filter = 'brightness(1.5) drop-shadow(0 0 15px rgba(255, 255, 255, 0.9))';
});
binzhouMarker.on('mouseout', function() {
this.getElement().style.filter = 'brightness(1) drop-shadow(0 0 10px rgba(255, 255, 255, 0.8))';
});
// 菏泽涟漪点交互
hezeMarker.on('mouseover', function() {
this.getElement().style.filter = 'brightness(1.5) drop-shadow(0 0 15px rgba(255, 255, 255, 0.9))';
});
hezeMarker.on('mouseout', function() {
this.getElement().style.filter = 'brightness(1) drop-shadow(0 0 10px rgba(255, 255, 255, 0.8))';
});
}
// 创建济南到滨州的白色脉冲弧线
function updateJinanToBinzhouLine() {
const jinanCoords = shandongCities["济南市"];
const binzhouCoords = shandongCities["滨州市"];
const arcPoints = calculateArcPoints(jinanCoords, binzhouCoords, 0.3);
if (!jinanToBinzhouLine) {
jinanToBinzhouLine = L.polyline(arcPoints, {
color: '#ffffff',
weight: 3,
opacity: 0.8,
lineCap: 'round',
lineJoin: 'round',
className: 'city-connection-line curve-jn-bz',
}).addTo(map);
setupLineInteractions(jinanToBinzhouLine, '济南 ↔ 滨州', '重点合作线路', '#ffffff');
} else {
jinanToBinzhouLine.setLatLngs(arcPoints);
}
}
function updateJinanToHezeLine() {
const jinanCoords = shandongCities["济南市"];
const hezeCoords = shandongCities["菏泽市"];
const arcPoints = calculateArcPoints(jinanCoords, hezeCoords, 0.4);
if (!jinanToHezeLine) {
jinanToHezeLine = L.polyline(arcPoints, {
color: '#ffffff',
weight: 2,
opacity: 0.8,
lineCap: 'round',
lineJoin: 'round',
className: 'city-connection-line curve-jn-hz',
dashArray: null
}).addTo(map);
setupLineInteractions(jinanToHezeLine, '济南 ↔ 菏泽', '', '#ffffff');
} else {
jinanToHezeLine.setLatLngs(arcPoints);
}
}
// 设置连接线的交互效果
function setupLineInteractions(line, title, description, color) {
line.bindTooltip(
`${title}<br>${description}`,
{
permanent: false,
direction: 'top',
className: 'connection-tooltip',
offset: [0, -10]
}
);
line.on('mouseover', function() {
this.setStyle({
weight: 5,
opacity: 1,
color: color
});
highlightRipplePoints(this.options.className);
});
line.on('mouseout', function() {
this.setStyle({
weight: 3,
opacity: 0.8,
color: color
});
resetRipplePoints();
});
}
// 高亮相关涟漪点
function highlightRipplePoints(lineClass) {
if (jinanMarker && jinanMarker.getElement()) {
jinanMarker.getElement().style.filter = 'brightness(2) drop-shadow(0 0 20px rgba(255, 255, 255, 1))';
}
if (lineClass.includes('curve-jn-bz')) {
if (binzhouMarker && binzhouMarker.getElement()) {
binzhouMarker.getElement().style.filter = 'brightness(2) drop-shadow(0 0 20px rgba(255, 255, 255, 1))';
}
} else if (lineClass.includes('curve-jn-hz')) {
if (hezeMarker && hezeMarker.getElement()) {
hezeMarker.getElement().style.filter = 'brightness(2) drop-shadow(0 0 20px rgba(255, 255, 255, 1))';
}
}
}
// 恢复涟漪点样式
function resetRipplePoints() {
if (jinanMarker && jinanMarker.getElement()) {
jinanMarker.getElement().style.filter = 'brightness(1) drop-shadow(0 0 10px rgba(255, 255, 255, 0.8))';
}
if (binzhouMarker && binzhouMarker.getElement()) {
binzhouMarker.getElement().style.filter = 'brightness(1) drop-shadow(0 0 10px rgba(255, 255, 255, 0.8))';
}
if (hezeMarker && hezeMarker.getElement()) {
hezeMarker.getElement().style.filter = 'brightness(1) drop-shadow(0 0 10px rgba(255, 255, 255, 0.8))';
}
}
// 添加所有连接线及端点标记
function addAllConnections() {
// 初始化所有端点标记
initConnectionMarkers();
// 添加济南到滨州弧线
updateJinanToBinzhouLine();
// 添加济南到菏泽弧线
updateJinanToHezeLine();
// 添加CSS动画
addLineAnimations();
}
// 添加线路动画
function addLineAnimations() {
// 为每条线路添加动画
if (jinanToBinzhouLine) {
jinanToBinzhouLine.getElement().style.animation = 'whitePulse 2s infinite ease-in-out';
}
if (jinanToHezeLine) {
jinanToHezeLine.getElement().style.animation = 'whitePulse 1.5s infinite ease-in-out';
}
}
</script>


