qq_39538215 2017-09-07 09:39 采纳率: 14.3%
浏览 1080

echarts折线图问题! 大神求教

自己做的图片说明
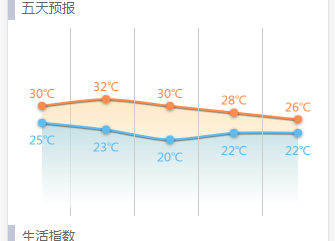
自己做的效果图 我遇到两个问题 一个echarts两个折线图下面渐变色区域叠堆了如何解决

第二个我想让他从屏幕最左侧出来到最右侧消失 但是节点还是只显示这五个如何解决

series : [ {
name : '最高气温',
type : 'line',
smooth : true,
showAllSymbol : true,
symbolSize : 8,
symbol : 'circle',
itemStyle : {
/*
* normal:{areaStyle:{color: '#DDEAFB', shadowBlur: 10,
* shadowColor: 'rgba(0, 0, 0, 2)'}}
*/
normal : {
color : '#FF8B4C',
shadowColor : 'rgba(0, 0, 0, 0.5)',
shadowBlur : 8,
shadowOffsetY : 2
}
},

            //渐变色设置 
            areaStyle: {
                normal: {
                    color: new echarts.graphic.LinearGradient(0, 0, 0, 1, [{
                        offset: 0,
                        color: 'rgba(251,209,139,0.7)'
                    }, {
                        offset: 1,
                        color: 'rgba(255,255,255,0.6)'
                    }])
                }
            },

            lineStyle : {
                normal : {
                    shadowColor : 'rgba(0, 0, 0, 0.5)',
                    shadowBlur : 2,
                    shadowOffsetY : 2
                }
            },
            label : {
                normal : {
                    show : true,
                    position : 'top',
                    formatter : '{c}℃'
                }
            },
            data : data1
        }, {
            name : '最低气温',
            type : 'line',
            smooth : true,
            showAllSymbol : true,
            symbolSize : 8,
            symbol : 'circle',
            itemStyle : {
                /*
                 * normal:{areaStyle:{color: '#B6E6D0', shadowBlur: 20,
                 * shadowColor: 'rgba(0, 0, 0, 2)'}}
                 */

                normal : {
                    color : '#5FBCF2',
                    shadowColor : 'rgba(0, 0, 0, 0.5)',
                    shadowBlur : 8,
                    shadowOffsetY : 2
                }
            },
            areaStyle: {
                normal: {
                    color: new echarts.graphic.LinearGradient(0, 0, 0, 1, [{
                        offset: 0,
                        color: 'rgba(137,208,245,0.7)'
                    }, {
                        offset: 1,
                        color: 'rgba(255,255,255,0.6)'
                    }])
                }
            },
            lineStyle : {
                normal : {
                    shadowColor : 'rgba(0, 0, 0, 0.5)',
                    shadowBlur : 2,
                    shadowOffsetY : 2
                }
            },
            label : {
                normal : {
                    show : true,
                    position : 'bottom',
                    formatter : '{c}℃'
                }
            },
            data : lowest
        } ] 贴上我自己的代码
  • 写回答

0条回答

    报告相同问题?

    悬赏问题

    • ¥20 有关区间dp的问题求解
    • ¥15 多电路系统共用电源的串扰问题
    • ¥15 slam rangenet++配置
    • ¥15 有没有研究水声通信方面的帮我改俩matlab代码
    • ¥15 对于相关问题的求解与代码
    • ¥15 ubuntu子系统密码忘记
    • ¥15 信号傅里叶变换在matlab上遇到的小问题请求帮助
    • ¥15 保护模式-系统加载-段寄存器
    • ¥15 电脑桌面设定一个区域禁止鼠标操作
    • ¥15 求NPF226060磁芯的详细资料