
就像这个图一样。

就像这个图一样。
 分享
分享
 关注
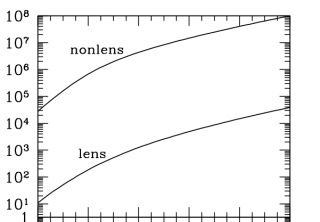
关注matplotlib提供了双轴函数,可以实现双x轴或双y轴绘图。
>>> import numpy as np
>>> from matplotlib import pyplot as plt
>>> x = np.linspace(1,10,100)
>>> y1 = np.power(x, 4)
>>> y2 = np.power(x, 3)
>>> fig = plt.figure()
>>> ax_left = fig.add_axes([0.1, 0.1, 0.8, 0.8])
>>> ax_right = ax_left.twinx()
>>> ax_left.semilogy(x, y1)
[<matplotlib.lines.Line2D object at 0x000002817B11CF08>]
>>> ax_right.semilogy(x, y2)
[<matplotlib.lines.Line2D object at 0x000002817AE1DAC8>]
>>> ax_right.set_ylim(1,10000)
(1, 10000)
>>> plt.show()

分享 系统已结题
8月5日
系统已结题
8月5日 已采纳回答
7月28日
已采纳回答
7月28日


