

需要根据现有的数据,画出箱型图,并在箱型图上用IQR方法找到异常值,并将异常值清楚
原题如下:
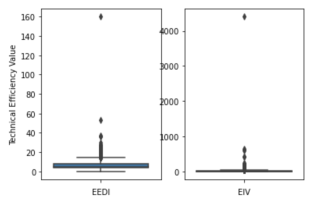
We want to compare distribution of EEDI an EIV values. We used matplotlib boxplot to draw two boxplots side by side to each other as shown below. We can see many outliers in the Technical Efficiency Values. Let's use IQR method to remove such outliers.
IQR Method: The interquartile range (IQR) is calculated as the difference between the 75th and the 25th percentiles of the data. The IQR method considers observations with values 1.5 times above that of the 25th percentile or above that of the 75th percentile as outliers.
For each dataframe, df_eedi and df_eiv, calculate the lower and upper limit for the Technical Efficiency Value. The lower limit is 1.5 times of IQR below 25th percentile whereas the upper limit is 1.5 times of IQR above 75th percentile.
想请教一下,该如何用语句执行IQR,并将异常值去除


