

react项目使用Chart画柱状图,图中的数据来自后端接口,这样要怎么画出效果中的样式?
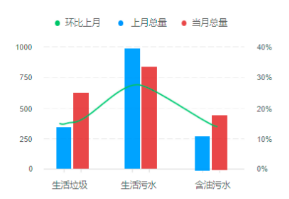
要求效果图
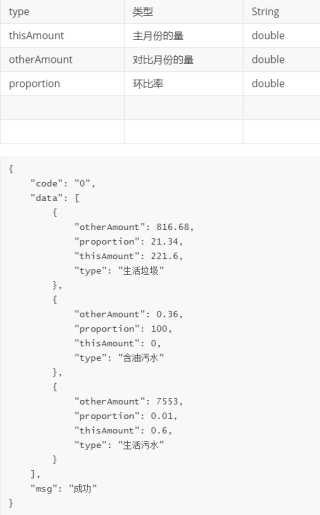
后端接口数据
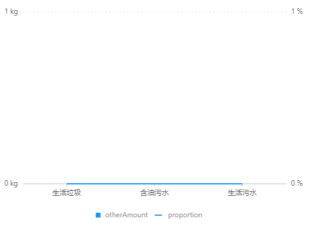
我现在画出来的效果
效果代码
queryGreat({
            thisMonth: params.month[0].format("YYYY-MM"),
            otherMonth: params.month[1].format("YYYY-MM"),
        }).then(res => {
            if (res.code === '0' && Array.isArray(res.data) && res.data.length === 3) {
                let allData = res.data
                setChartData(allData)
            }
        })
<Chart height={400} data={data.map(item => {
      item.pino = parseFloat(item.pino)
      return item;
    })} forceFit padding={[48, 48, 64, 64]}>
      <Axis name="type" />
      <Axis name="thisAmount" label={{
        formatter: (text) => {
          return `${text} kg`
        }
      }} />
      <Axis name="otherAmount" label={{
        formatter: (text) => {
          return `${text} kg`
        }
      }} />
      <Axis name="proportion" label={{
        formatter: (text) => {
          return `${text} %`
        }
      }} />
      <Tooltip />
      <Legend color='label' />
      <Interval type='interval' position="type*otherAmount"
        tooltip={['label*type*otherAmount', (label, type, otherAmount,) => {
          return {
            //自定义 tooltip 上显示的 title 显示内容等。
            name: label,
            title: type,
            value: otherAmount + ' kg'
          };
        }]}
        adjust={[
          {
            type: "dodge",
            marginRatio: 1 / 32
          }
        ]}
      />
      <Line position='type*proportion'
        tooltip={['label*type*proportion', (label, type, proportion) => {
          return {
            //自定义 tooltip 上显示的 title 显示内容等。
            name: label,
            title: type,
            value: proportion + ' %'
          };
        }]}
      />
    </Chart>
  )
}
要怎么处理数据才能做出效果图中的样式?


