加菲大帅猫 2022-04-13 11:10 采纳率: 37.8%
浏览 31
已结题

echarts图表宽度不能自适应了,并且一直报There is a chart instance already initialized on the dom.

问题遇到的现象和发生背景

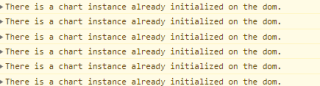
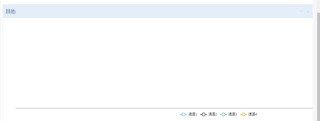
使用echarts是,图表不能随着窗口的大小改变了,一直报警告

img

img

问题相关代码,请勿粘贴截图
<div id="myChart" style="width:1557px;height:350px"></div>


var myChart;
      if (myChart != null && myChart != "" && myChart != undefined){
            myChart.dispose();
        }
      myChart = echarts.init(document.getElementById("myChart"));
        myChart.setOption(this.option_TIE);
        this.$nextTick(function () {
        // 图表自适应
        window.addEventListener("resize", function () {
            echarts.init(document.getElementById("myChart")).resize();
            
        });
        });

option_TIE:{
                    title: {
                        text: ' ',
                        subtext: ' ',
                        x: 'center',
                        y: 'top'
                    },
                    tooltip: {
                        trigger: 'axis',
                        axisPointer: {
                            animation: false
                        }
                    },
                    color: ['#63B8FF', '#3B3B3B', '#43CD80', '#EEB422'],
                    legend: {
                        data: this.legend_data_TIE,
                        orient: 'horizontal',
                        x: 'center', //可设定图例在左、右、居中
                        y: 'bottom', //可设定图例在上、下、居中
                        selected: this.legend_selected_TIE
                    },
                    toolbox: {
                        show: false,
                        feature: {
                            mark: {
                                show: true
                            },
                            dataView: {
                                show: true,
                                readOnly: true
                            },
                            restore: {
                                show: true
                            },
                            saveAsImage: {
                                show: true
                            }
                        }
                    },
                    grid: {
                        left: '3%',
                        right: '4%',
                        bottom: '10%', // 这几个属性可以控制图表上下左右的空白尺寸,可以自己试试。
                        containLabel: true
                    },
                    xAxis: {
                        show: true,
                        type: 'category',
                        splitLine: {
                            show: true
                        },
                        boundaryGap: false,
                        axisLine: {
                            onZero: false
                        },
                        axisLabel: {
                            rotate: 45,
                        },
                        data: this.xdata
                    },
                    yAxis: {
                        // max: 'dataMax',
                        // min: 'dataMin',
                        show: true,
                        scale: true,
                        type: 'value',
                        boundaryGap: ['20%', '20%'],
                        minInterval: 1,
                        splitLine: {
                            show: true
                        }
                    },
                    series: [{
                            name: '通道1',
                            type: 'line',
                            showSymbol: true,
                            smooth: true,
                            hoverAnimation: false,
                            connectNulls: false,
                            data: this.tie1
                        }, {
                            name: '通道2',
                            type: 'line',
                            showSymbol: true,
                            smooth: true,
                            hoverAnimation: false,
                            connectNulls: false,
                            data: this.tie2
                        }, {
                            name: '通道3',
                            type: 'line',
                            showSymbol: true,
                            smooth: true,
                            hoverAnimation: false,
                            connectNulls: false,
                            data: this.tie3
                        }, {
                            name: '通道4',
                            type: 'line',
                            showSymbol: true,
                            smooth: true,
                            hoverAnimation: false,
                            connectNulls: false,
                            data: this.tie4
                        }
                    ]
                }
运行结果及报错内容
我的解答思路和尝试过的方法

网上找了好多方法都不行

我想要达到的结果
  • 写回答

3条回答 默认 最新

  • qq_40262972 2022-04-13 11:28
    关注

    echarts.init(document.getElementById("myChart")).resize(); => myChart.resize(); 这样呢

    本回答被题主选为最佳回答 , 对您是否有帮助呢?
    评论
查看更多回答(2条)

报告相同问题?

问题事件

  • 系统已结题 4月27日
  • 已采纳回答 4月19日
  • 创建了问题 4月13日

悬赏问题

  • ¥15 smptlib使用465端口发送邮件失败
  • ¥200 总是报错,能帮助用python实现程序实现高斯正反算吗?有偿
  • ¥15 对于squad数据集的基于bert模型的微调
  • ¥15 为什么我运行这个网络会出现以下报错?CRNN神经网络
  • ¥20 steam下载游戏占用内存
  • ¥15 CST保存项目时失败
  • ¥15 树莓派5怎么用camera module 3啊
  • ¥20 java在应用程序里获取不到扬声器设备
  • ¥15 echarts动画效果的问题,请帮我添加一个动画。不要机器人回答。
  • ¥15 Attention is all you need 的代码运行