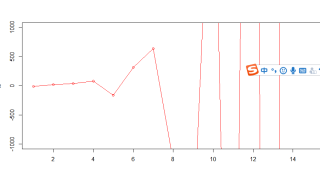
在用Rstudio模拟加倍投注法后,我本来希望得到一个在横坐标两端摇摆但是幅度越来越大的折线图,但是实际操作起来我的图不是因为y的范围太大就显得折线图几乎没有波动,要不就是y的范围太小图片显得非常狰狞,我不知道如何解决
i <- 0
xl <- c()
test <- c()
s <- 1
henzuobiao <- c()
allnum = c("00",0:36)
while(i<15)
{
x2 <- sample(allnum, 1,replace=TRUE)
test <- append(test,x2)
earn2 <- (x2 %in% seq(2,36,2))20s-10s
s <- s2
xl <- append(xl,earn2)
i=i+1
henzuobiao <- append(henzuobiao,i)
}
he<-sum(xl)
plot(henzuobiao,xl,xlim=c(1,15),ylim=c(-1000,1000),col="red",type="o")