

使用javaweb制作echars静态图像时我想要把两个图形输出在同一个html页面上,但是只能输出一个图像可以帮我看一下吗?
<!DOCTYPE html>
<html lang="en">
<head>
<meta charset="utf-8">
<title>数据可视化</title>
<meta name="viewport" content="width=device-width, initial-scale=1">
<meta http-equiv="x-ua-compatible" content="ie=edge">
</head>
<body >
<div style="margin: 0 auto; width: 500px;">
<div id="staff_month_orderCount" style="width: 300px;height:300px; margin-bottom: 20px"></div>
<div id="staff_all_orderCount" style="width: 300px;height:300px;"></div>
</div>
<script src="https://cdn.staticfile.org/echarts/4.3.0/echarts.min.js"></script>
<script type="text/javascript">
window.onload = function () {
echart01();
echart02();
function echart01() {
// 基于准备好的dom,初始化echarts实例
var myChart = echarts.init(document.getElementById('staff_month_orderCount'));
// 指定图表的配置项和数据
var option={
title:{
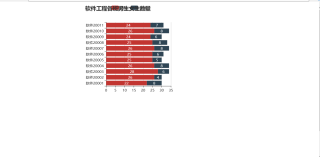
text:'软件工程各班男生女生数量'
} ,
tooltip: {
trigger: 'axis',
axisPointer: {
// Use axis to trigger tooltip
type: 'shadow' // 'shadow' as default; can also be 'line' or 'shadow'
}
},
legend: {},
grid: {
left: '3%',
right: '4%',
bottom: '3%',
containLabel: true
},
xAxis: {
type: 'value'
},
yAxis: {
type: 'category',
data: ['软件20001', '软件20002', '软件20003', '软件20004', '软件20005', '软件20006', '软件20007', '软件20008','软件20009','软件20010', '软件20011']
},
series: [
{
name: '男生',
type: 'bar',
stack: 'total',
label: {
show: true
},
emphasis: {
focus: 'series'
},
data: [22, 26, 28, 26, 25, 25, 26,25,24,26,24]
},
{
name: '女生',
type: 'bar',
stack: 'total',
label: {
show: true
},
emphasis: {
focus: 'series'
},
data: [8, 4, 6, 8, 5, 6, 8,8,6,8,7],
center: ['80%', '30%']
}],
}
myChart.setOption(option);
function echart02() {
// 基于准备好的dom,初始化echarts实例
var myChart = echarts.init(document.getElementById('staff_all_orderCount'),"light");
// 指定图表的配置项和数据
option = {
title: {
text: '软件工程全体男生女生占比',
left: 'center'
},
tooltip: {
trigger: 'item'
},
legend: {
orient: 'vertical',
left: 'left'
},
series: [
{
name: 'Access From',
type: 'pie',
radius: '50%',
data: [
{ value: 1048, name: '男' },
{ value: 735, name: '女' },
],
emphasis: {
itemStyle: {
shadowBlur: 10,
shadowOffsetX: 0,
shadowColor: 'rgba(0, 0, 0, 0.5)'
}
}
},
]
}
}}
option && myChart.setOption(option);}
</script>
</body>
</html>


