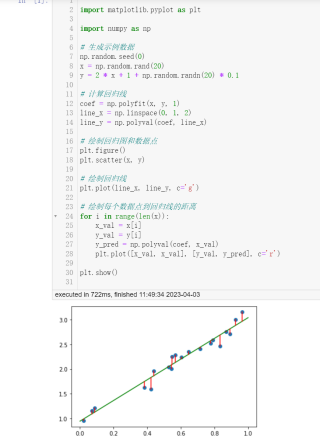
怎么画出每个点到直线的距离
import numpy as np
import matplotlib.pyplot as plt
from scipy import stats
# 构造训练数据
x = np.arange(0., 10., 0.2)
m = len(x)
x0 = np.full(m, 1.0)
input_data = np.vstack([x0, x]).T
target_data = 2 * x + 5 + np.random.randn(m)
# 终止条件
loop_max = 10000 # 最大迭代次数
epsilon = 1e-3 # 收敛条件最小值
# 初始化权值
np.random.seed(0)
theta = np.random.randn(2)
alpha = 0.001 # 步长
diff = 0.
error = np.zeros(2)
count = 0 # 循环次数
finish = 0 # 终止标志
# 迭代
while count < loop_max:
count += 1
# 在标准梯度下降中,权值更新的每一步对多个样例求和,需要更多的计算
sum_m = np.zeros(2)
for i in range(m):
dif = (np.dot(theta, input_data[i]) - target_data[i]) * input_data[i]
# 当alpha取值过大时,sum_m会在迭代过程中会溢出
sum_m = sum_m + dif
# 注意步长alpha的取值,过大会导致振荡
theta = theta - alpha * sum_m
# 判断是否已收敛
if np.linalg.norm(theta - error) < epsilon:
finish = 1
break
else:
error = theta
print('迭代次数 = %d' % count, '\t w:', theta)
print('迭代次数 = %d' % count, '\t w:', theta)
# 用scipy线性回归进行检查
slope, intercept, r_value, p_value, slope_std_error = stats.linregress(x,
target_data)
print('截距 = %s 斜率 = %s' % (intercept, slope))
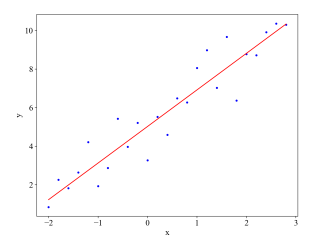
# 用plot进行展示
plt.plot(x, target_data, 'b*')
plt.plot(x, theta[1] * x + theta[0], 'r')
plt.xlabel("x")
plt.ylabel("y")
plt.show()