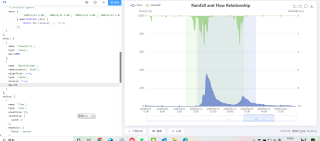
遇到问题,初步思路
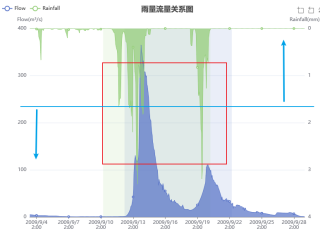
产品要求雨量、流量要能分开显示,图中的雨量和流量有显示交叉;
目前没思路,不知道怎么弄好,求指点
代码块,运行结果
option = {
  title: {
    text: '雨量流量关系图',
    left: 'center'
  },
  grid: {
    bottom: 80
  },
  toolbox: {
    feature: {
      dataZoom: {
        yAxisIndex: 'none'
      },
      restore: {},
      saveAsImage: {}
    }
  },
  tooltip: {
    trigger: 'axis',
    axisPointer: {
      type: 'cross',
      animation: false,
      label: {
        backgroundColor: '#505765'
      }
    }
  },
  legend: {
    data: ['Flow', 'Rainfall'],
    left: 10
  },
  dataZoom: [
    {
      show: true,
      realtime: true,
      start: 65,
      end: 85
    },
    {
      type: 'inside',
      realtime: true,
      start: 65,
      end: 85
    }
  ],
  xAxis: [
    {
      type: 'category',
      boundaryGap: false,
      axisLine: { onZero: false },
      // prettier-ignore
      data: [
                '2009/6/12 2:00', '2009/6/12 3:00', '2009/6/12 4:00', '2009/6/12 5:00', '2009/6/12 6:00', '2009/6/12 7:00', '2009/6/12 8:00', '2009/6/12 9:00', '2009/6/12 10:00', '2009/6/12 11:00', '2009/6/12 12:00', '2009/6/12 13:00', '2009/6/12 14:00', '2009/6/12 15:00', '2009/6/12 16:00', '2009/6/12 17:00', '2009/6/12 18:00', '2009/6/12 19:00', '2009/6/12 20:00', '2009/6/12 21:00', '2009/6/12 22:00', '2009/6/12 23:00', '2009/6/13 0:00', '2009/6/13 1:00', '2009/6/13 2:00', '2009/6/13 3:00', '2009/6/13 4:00', '2009/6/13 5:00', '2009/6/13 6:00', '2009/6/13 7:00', '2009/6/13 8:00', '2009/6/13 9:00', '2009/6/13 10:00', '2009/6/13 11:00', '2009/6/13 12:00', '2009/6/13 13:00', '2009/6/13 14:00', '2009/6/13 15:00', '2009/6/13 16:00', '2009/6/13 17:00', '2009/6/13 18:00', '2009/6/13 19:00', '2009/6/13 20:00', '2009/6/13 21:00', '2009/6/13 22:00', '2009/6/13 23:00', '2009/6/14 0:00', '2009/6/14 1:00', '2009/6/14 2:00', '2009/6/14 3:00', '2009/6/14 4:00', '2009/6/14 5:00', '2009/6/14 6:00', '2009/6/14 7:00', '2009/6/14 8:00', '2009/6/14 9:00', '2009/6/14 10:00', '2009/6/14 11:00', '2009/6/14 12:00', '2009/6/14 13:00', '2009/6/14 14:00', '2009/6/14 15:00', '2009/6/14 16:00', '2009/6/14 17:00', '2009/6/14 18:00', '2009/6/14 19:00', '2009/6/14 20:00', '2009/6/14 21:00', '2009/6/14 22:00', '2009/6/14 23:00'
            ].map(function (str) {
                return str.replace(' ', '\n');
            })
    }
  ],
  yAxis: [
    {
      name: 'Flow(m³/s)',
      type: 'value'
    },
    {
      name: 'Rainfall(mm)',
      nameLocation: 'start',
      alignTicks: true,
      type: 'value',
      inverse: true
    }
  ],
  series: [
    {
      name: 'Flow',
      type: 'line',
      areaStyle: {},
      lineStyle: {
        width: 1
      },
      emphasis: {
        focus: 'series'
      },
      markArea: {
        silent: true,
        itemStyle: {
          opacity: 0.3
        },
        data: [
          [
            {
              xAxis: '2009/6/12\n7:00'
            },
            {
              xAxis: '2009/6/14\n7:00'
            }
          ]
        ]
      },
      // prettier-ignore
      data: [
                0.97, 0.96, 0.96, 0.95, 0.95, 0.94, 0.94, 0.94, 0.94, 0.94, 0.94, 0.94, 0.94, 0.94, 0.94, 0.94, 0.94, 0.94, 0.94, 0.94, 0.94, 0.94, 0.94, 0.94, 0.94, 0.94, 0.94, 0.94, 0.94, 0.94, 0.94, 0.94, 0.94, 0.94, 0.94, 0.93, 0.92, 0.91, 0.9, 0.89, 0.88, 0.87, 0.87, 0.86, 0.86, 0.86, 0.86, 0.86, 0.86, 0.86, 0.86, 0.86, 0.86, 0.86, 0.86, 0.86, 0.86, 0.86, 0.86, 0.86, 0.86, 0.86, 0.86, 0.86, 0.86, 0.86, 0.86, 0.86, 0.86, 0.87
            ]
    },
    {
      name: 'Rainfall',
      type: 'line',
      yAxisIndex: 1,
      areaStyle: {},
      lineStyle: {
        width: 1
      },
      emphasis: {
        focus: 'series'
      },
      markArea: {
        silent: true,
        itemStyle: {
          opacity: 0.3
        },
        data: [
          [
            {
              xAxis: '2009/6/12\n7:00'
            },
            {
              xAxis: '2009/6/14\n7:00'
            }
          ]
        ]
      },
      // prettier-ignore
      data: [
                 0, 0.005, 0.017, 0.017, 0.017, 0.017, 0.011, 0, 0.024, 0.006, 0.003, 0.303, 1.028, 1.328, 1.524, 1.41, 1.362, 1.292, 1.191, 0.529, 0.501, 0.944, 1.81, 2.899, 0.859, 0.126, 0.087, 0.047, 0, 0.011, 0.028, 0.028, 0.028, 0.028, 0.017, 0, 0.614, 0.818, 1.436, 1.195, 0.031, 0.023, 0.022, 0.007, 0.005, 0.005, 0.001, 0, 0.02, 0.048, 0.048, 0.053, 0.056, 0.036, 0.036, 0.068, 0.095, 0.233, 0.272, 0.377, 0.722, 1.494, 3.756, 0.954, 0.439, 0.442, 0.462, 0.373, 0.249, 0.818
            ]
    }
  ]
};
软件版本信息
echarts版本5.0