
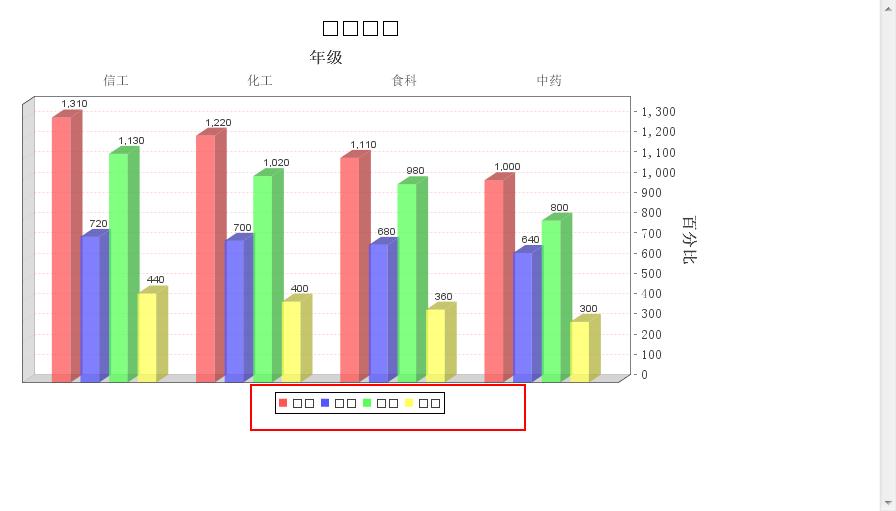
横坐标是数组是数组 [年级][学院] 的时候,设置横坐标的字体,[学院]出现方格。求大神搭救!!
<%
double[][] data = new double[][] {{1310, 1220, 1110, 1000},
{720, 700, 680, 640},
{1130, 1020, 980, 800},
{440, 400, 360, 300}};
String[] rowKeys = {"大一", "大二","大三", "大四"};
String[] columnKeys = {"信工", "化工", "食科", "中药"};
CategoryDataset dataset = DatasetUtilities.createCategoryDataset(rowKeys, columnKeys, data);
JFreeChart chart = ChartFactory.createBarChart3D("实习人数",
"年级",
"百分比",
dataset,
PlotOrientation.VERTICAL,
true,
true,
false);
CategoryPlot plot = chart.getCategoryPlot();
//设置网格背景颜色
Font font=new Font("微软雅黑",Font.BOLD,18);
CategoryAxis domainAxis = plot.getDomainAxis(); //获得X轴
domainAxis.setVisible(true);
plot.setDomainAxis(domainAxis);
ValueAxis rAxis = plot.getRangeAxis(); //获得Y轴
//设置X轴坐标上的文字
domainAxis.setTickLabelFont(new Font("宋体", Font.PLAIN, 13));
//设置X轴的标题文字
domainAxis.setLabelFont(new Font("宋体", Font.BOLD, 16));
//设置Y轴坐标上的文字
rAxis.setTickLabelFont(new Font("宋体", Font.PLAIN, 13));
//设置Y轴的标题文字
rAxis.setLabelFont(new Font("宋体", Font.BOLD, 16));
plot.setBackgroundPaint(Color.white);
//设置网格竖线颜色
plot.setDomainGridlinePaint(Color.pink);
//设置网格横线颜色
plot.setRangeGridlinePaint(Color.pink);
//显示每个柱的数值,并修改该数值的字体属性
BarRenderer3D renderer = new BarRenderer3D();
renderer.setBaseItemLabelGenerator(new StandardCategoryItemLabelGenerator());
renderer.setBaseItemLabelsVisible(true);
//默认的数字显示在柱子中,通过如下两句可调整数字的显示
//注意:此句很关键,若无此句,那数字的显示会被覆盖,给人数字没有显示出来的问题
renderer.setBasePositiveItemLabelPosition(new ItemLabelPosition(ItemLabelAnchor.OUTSIDE12, TextAnchor.BASELINE_LEFT));
renderer.setItemLabelAnchorOffset(10D);
//设置每个地区所包含的平行柱的之间距离
//renderer.setItemMargin(0.3);
plot.setRenderer(renderer);
//设置地区、销量的显示位置
//将下方的“肉类”放到上方
plot.setDomainAxisLocation(AxisLocation.TOP_OR_RIGHT);
//将默认放在左边的“销量”放到右方
plot.setRangeAxisLocation(AxisLocation.BOTTOM_OR_RIGHT);
String filename = ServletUtilities.saveChartAsPNG(chart, 700, 400, null, session);
String graphURL = request.getContextPath() + "/DisplayChart?filename=" + filename;
%>


