


1条回答 默认 最新
 joel_1993 2021-10-14 10:00关注
你好同学:
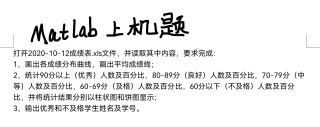
T = readtable('2020-10-12.xls', 'PreserveVariableNames',true);
xuehao = T{:, '学号'};
xingming = T{:,'姓名'};
chengji = T{:,'成绩'};
% (1)
figure(1); clf
plot(chengji); hold on
yline(mean(cheng))
% (2)
figure(2); clf;
Q = histogram(randi([0,100],10000,1), [0,60:10:100]);
figure(3);clf
p = h.Values;
x=({'0-60','60-69','70-79','80-89','90-100'});
for i = 1:size(x,2)
    x{1,i} = [x{1,i},' (',num2str((p(i)/sum(p))*100,'%.1f'),'%)'];
end
explode=ones(1,numel(p));
pie(p,explode,x)
colormap(jet)
% (3)
q = chengji<60;
bujige = table(xingming(q), xuehao(q), chengji(q))
q = chengji>=90;
bujige = table(xingming(q), xuehao(q), chengji(q))
有帮助望采纳
本回答被题主选为最佳回答 , 对您是否有帮助呢?评论 打赏解决 1无用举报 分享
分享
- 2021-10-13 22:00回答 1 已采纳 你好同学: T = readtable('2020-10-12.xls', 'PreserveVariableNames',true); xuehao = T{:, '学号'}; xingming =
- 2021-06-11 13:14回答 1 已采纳 你好,我是有问必答小助手,非常抱歉,本次您提出的有问必答问题,超出我们目前的服务范围,暂时无法为您解答。 问答VIP目前服务范围为 :Python、Java、MySQL、Redis、MongoDB、
- 2021-10-18 18:02回答 1 已采纳 你好,代码供参考: % 实验2 x = [81, 70, 65, 51, 76,66,90,87,61,77]; n = length(x); x_mean = sum(x)/n%均值,也可以用x_
- 2021-04-21 12:56胡毛毛_三月的博客 目录实验一、熟悉MATLAB环境和基本信号的产生与运算 实验一、熟悉MATLAB环境和基本信号的产生与运算 实验一、熟悉MATLAB环境和基本信号的产生与运算
- 2023-02-17 19:31回答 3 已采纳 在 if isempty(routepart) 下面的 flagb 变量没有定义。如果 routepart 为空,那么程序会执行 flagb=j-1;,但是在后面的代码中,如果 flagb 没有被定义
- 2021-11-12 17:00回答 1 已采纳 这应该是最基础的自动控制题目,给个第一问的结果,第2问你按照我的提示再去摸索。 a = 1; h = 28; % 学号 h2 = 8; b = 2; % 班级号 % 传递函数 Gs = tf(
- 2021-10-26 14:39回答 1 已采纳 你好,代码供参考 x=[120 150 180 210 240 270 300 330 360 390 420 450]; y=[101.2 99.6 97.9 96.6 94.9 93.6 92.0
- 2022-07-01 15:10dream_fjh的博客 写给MATLAB新手的几句话
- 2021-06-16 09:23回答 1 已采纳 推导过程大概就是这样,第三题波形大概画出来了,推导过程和前两题没啥区别,可以由前两题不断开关的过程得到。 这个题出得挺奇怪的,开关电源一般分析开关过程的动态平衡,这个题。。。 这个可以参考一下
- 2021-10-26 13:56回答 1 已采纳 Gauss消去法、列主元素消去法及LU分解法的MATLAB实现_slandarer的博客-CSDN博客 去年的时候写的,整理一下发上来Ga
- 2021-07-27 15:38回答 1 已采纳 你前面只有一个圆环,后面又出现10个圆环,表述十分混乱
- 2011-03-07 04:37kit_147的博客 【kit_147】这篇文章写得很好,很多时候用MATLAB写程序的确还是脱离不了用编程语言编程的思想;MATLAB其实是要“面向矩阵编程”,所以稍微有所不同。 转自 ...
- 2021-11-03 15:03回答 1 已采纳 你好,比如第三题 n = 1; s = 1; ds = 1; f = n; while (ds>1e-5) s = s+ds; n=n+1; f = f*n; ds = 1/f; end fpr
- 2012-10-19 09:04wanxiu.的博客 在网上看到一下关于matlab学习体会的心得,觉得不错,就推荐上来了!:lol /*************************************************************************...本人接触matlab已经有5年多的时间了,一直想写点东西,但是之
- 2014-04-28 19:54xinyizhangwei的博客 首先我想说的是,matlab跟其他语言不一样(我用的比较多的编程语言,除了matlab就应该是c或c++了,VB和Delphi也接触过,我想版面(matlab版)大部分人也差不多),如果你抱着“把其他语言的思想运用在matlab里面”的...
- 没有解决我的问题, 去提问


问题事件
 系统已结题
4月26日
系统已结题
4月26日 已采纳回答
4月18日
已采纳回答
4月18日-
创建了问题
10月13日
悬赏问题
- ¥100 set_link_state
- ¥15 虚幻5 UE美术毛发渲染
- ¥15 CVRP 图论 物流运输优化
- ¥15 Tableau online 嵌入ppt失败
- ¥100 支付宝网页转账系统不识别账号
- ¥15 基于单片机的靶位控制系统
- ¥15 真我手机蓝牙传输进度消息被关闭了,怎么打开?(关键词-消息通知)
- ¥15 装 pytorch 的时候出了好多问题,遇到这种情况怎么处理?
- ¥20 IOS游览器某宝手机网页版自动立即购买JavaScript脚本
- ¥15 手机接入宽带网线,如何释放宽带全部速度