
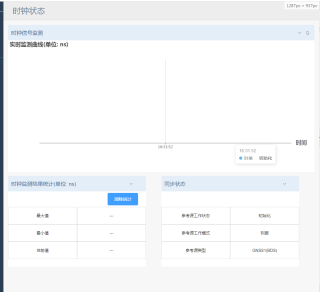
问题遇到的现象和发生背景
当改变浏览器窗口时,echarts父元素的大小会发生变化,但是echarts的大小不会发生变化
问题相关代码,请勿粘贴截图
<template>
<div>
    <div>
        <el-collapse v-model="activeNames">
            <el-collapse-item name="1" class="top-zd ">
                <template slot="title">
                    <span class="top-text">时钟信号监测
                        </span> <i class="el-icon-refresh icon-s"  @click="fundel"></i>
                </template>

                <div id="myChart" ></div>
            </el-collapse-item>
        </el-collapse>
    </div>
    <div class="box-top">
        <div class="left"> <el-collapse v-model="activeNames">
            <el-collapse-item name="2"  class="top-zd">
                <template slot="title">
                   <span class="top-text">时钟监测结果统计(单位: ns)
                       </span>
                </template>
                <div class="left-top">
                    <el-button type="primary" @click="fundel">清除统计</el-button>
                </div>
                <div>
                    <table cellspacing="0" cellpandding='0'>
                        <tr><td>最大值</td><td>{{a}}</td></tr>
                        <tr><td>最小值</td><td>{{b}}</td></tr>
                        <tr><td>当前值</td><td>{{c}}</td></tr>
                    </table>
                </div>
            </el-collapse-item>
        </el-collapse></div>
        <div class="right"> <el-collapse v-model="activeNames">
            <el-collapse-item  name="3"  class="top-zd">
                <template slot="title">
                    <span class="top-text">
                        同步状态
                    </span>

                </template>
                <div class="right-top">
                    <table cellspacing="0" cellpandding='0' class="table-box3">
                        <tr><td>参考源工作状态</td><td>{{difference[1]}}</td></tr>
                        <tr><td>参考源工作模式</td><td>{{difference[2]}}</td></tr>
                        <tr><td>参考源类型</td><td>{{difference[3]}}</td></tr>
                    </table>
                </div>
            </el-collapse-item>
        </el-collapse></div>
    </div>
</div>


</template>

<script>
import * as echarts from 'echarts'
import getlink from "@/api/getapi.js"

export default {
    name: 'DynamicLineChart',
    data () {
        return {
             activeNames: ['1','2','3'],
             a:0,
             b:0,
             c:0,
             d:"213121132",
            // 实时数据数组
            timerr:'',
            date: [],
            difference:[],
            yieldRate: [],
            null:'',
            // yieldIndex: [],
            // 折线图echarts初始化选项
            echartsOption: {
                title: {
                    text: '实时监测曲线(单位: ns)'
                },
                legend: {
                    data: ['时钟信号监测'],
                },
                xAxis: {
                    name: '时间',
                    nameTextStyle: {
                        fontWeight: 600,
                        fontSize: 18
                    },
                    type: 'category',
                    boundaryGap: false,
                    data: this.date,    // 绑定实时数据数组
                },
                yAxis: {

                    nameTextStyle: {
                        fontWeight: 600,
                        fontSize: 18
                    },
                    type: 'value',
                    scale: true,
                    boundaryGap: ['15%', '15%'],
                    axisLabel: {
                        interval: 'auto',
                        formatter: '{value}'
                    }
                },
                tooltip: {
                    trigger: 'axis',
                },
                series: [
                    {
                        name:'时差',
                        type:'line',
                        smooth: true,
                        data: this.yieldRate,    // 绑定实时数据数组
                    },
                    // {
                    //     name:'大盘收益率',
                    //     type:'line',
                    //     smooth: true,
                    //     data: this.yieldIndex,    // 绑定实时数据数组
                    // }
                ],
                 z: 100
            }
        }
    },
    mounted () {
        this.myChart = echarts.init(document.getElementById('myChart'), 'light');    // 初始化echarts, theme为light
        this.myChart.setOption(this.echartsOption);
        this.timea();    // echarts设置初始化选项
        setInterval(this.addData, 1000);    // 每三秒更新实时数据到折线图
        this.timerr = setInterval(this.time, 1000);

    },
     beforeDestroy() {
    if (this.timerr) {
      clearInterval(this.timerr); //关闭
    }
  },
    methods: {
       timea(){
          getlink("api/cgi-bin/ClockState.cgi?" + "JetLag").then((ok)=>{

            this.difference = ok.data.split('|')
            this.a=this.difference[0];
            this.b=this.difference[0];
            })
      },
      time(){
          getlink("api/cgi-bin/ClockState.cgi?" + "JetLag").then((ok)=>{
            this.difference = ok.data.split('|')
            if(isNaN(parseInt(this.difference[0]))){
                this.a="---"
                this.b="---"
                this.c="---"
                this.difference.unshift("空")
            }else{
                this.c=parseInt(this.difference[0])
            if(this.c>this.a){
                    this.a=this.c

                }else if(this.c<this.b){
                    this.b=this.c
                }
            }

            })
      },
      fundel(){
          this.yieldRate.splice(0,this.yieldRate.length);
          this.a=0;
          this.b=0;
          this.c=0;
          this.date.splice(0,this.date.length);
          this.echartsOption.xAxis.data=this.date;

      },
        // 获取当前时间

        getTime : function() {
            var ts = arguments[0] || 0;
            var t, h, i, s;
            t = ts ? new Date(ts * 1000) : new Date();
            h = t.getHours();
            i = t.getMinutes();
            s = t.getSeconds();
            // 定义时间格式
            return (h < 10 ? '0' + h : h) + ':' + (i < 10 ? '0' + i : i) + ':' + (s < 10 ? '0' + s : s);
        },
        // 添加实时数据
        addData : function() {
            // 从接口获取数据并添加到数组
                if(this.difference[0]=="空"){
                   this.null=""
                }else{
                this.yieldRate.push(this.difference[0]);
                // this.yieldIndex.push("2");
                this.date.push(this.getTime(Math.round(new Date().getTime() / 1000)));
                // 重新将数组赋值给echarts选项
                this.echartsOption.xAxis.data = this.date;
                this.echartsOption.series[0].data = this.yieldRate;
                // this.echartsOption.series[1].data = this.yieldIndex;
                this.myChart.setOption(this.echartsOption);
                }

        }
    }
}
</script>
运行结果及报错内容
我的解答思路和尝试过的方法
在网上找了好多方法,都试了试,都没有效果


