

2条回答 默认 最新
 Stavin Li 2019-07-10 14:35关注
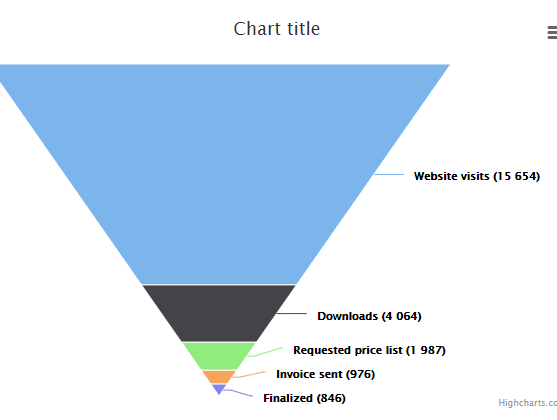
https://jshare.com.cn/github/highcharts/highcharts/tree/master/samples/highcharts/demo/funnel/
Highcharts.chart('container', {
  chart: {
    type: 'funnel'
  },
  tooltip: {
    pointFormat: '{series.name}: <b>{point.x}</b>',
  },
  plotOptions: {
    series: {
      dataLabels: {
        enabled: true,
        format: '<b>{point.name}</b> ({point.x:,.0f})',
        softConnector: true
      },
      center: ['40%', '50%'],
      neckWidth: '0',
      neckHeight: '0',
      width: '80%'
    }
  },
  series: [{
    name: '用户',
    data: [
      {name:'Website visits', x: 15654,y:1},
      {name:'Downloads',x: 4064,y:1},
      {name:'Requested price list', x: 1987,y:1},
      {name:'Invoice sent', x: 976,y:1},
      {name:'Finalized',x:  846,y:1}
    ]
  }]
});
本回答被题主选为最佳回答 , 对您是否有帮助呢?解决 无用评论 打赏举报 分享
分享
- 2019-07-10 15:10renkai721的博客 var chart = Highcharts.chart('container', { chart: { type: 'funnel', marginRight: 100, zoomType: 'xy' }, title: { text: '3年级2班开发人员统计图', x: -50 }...
- 2023-03-09 11:47在前端开发中,数据可视化是不可或缺的一部分,Highcharts是一个强大的JavaScript图表库,它提供了丰富的图表类型,包括柱状图、折线图、饼图以及我们这里关注的Venn图(韦恩图)。Venn图是一种特殊的图表,常用于...
- 2020-12-13 21:47Highcharts 3D图 本章节我们将为大家介绍 Highcharts 的3D图。 序号 图表类型 1 3D 柱形图 2 带空值的3D 柱形图 3 堆叠 3D 柱形图 4 3D 饼图 5 3D 圆环图
- 2024-04-06 01:32本资源提供了一套基于Vue和Highcharts的地图组件的设计源码,包含204个文件,其中包括76个Markdown文档,56个Vue组件文件,以及43个JavaScript脚本文件。此外,还包括6个Highcharts的Header文件,4个PNG图片文件,...
- 2023-12-12 08:56mountainariver的博客 设置series时设置dashStyle: 'dot'即可设置折线。
- 2018-07-23 13:13Highcharts是一款广泛应用于前端开发中的JavaScript图表库,它以其易用性和灵活性著称,能够帮助开发者轻松创建出各种丰富的数据可视化效果。这个压缩包文件名"highChart"可能包含了Highcharts的相关示例代码或者...
- 2019-09-04 22:24柱状图是其中最常用的一种,它以垂直条形的高度来表示数据系列的值,非常适合展示分类数据的比较。 在Highcharts中创建柱状图,首先需要在HTML文件中引入Highcharts的相关库文件。这通常通过在`<head>`标签内添加...
- 2025-11-15 09:20HighCharts的boost插件是大数据量下可视化的强大工具,它通过优化性能满足了在Web前端快速渲染大量数据点的需求。这种技术的实现,不仅提升了用户体验,更拓展了数据可视化在大数据时代的应用范围。
- 2022-09-20 11:35九持的博客 highcharts 高度自适应
- 2025-11-17 07:42文章强调了通过设置特定的高度值(h参数),可以使环形图中的每个扇形区块展示出不同的立体高度,这在传统的2D图表中是无法实现的。这种差异化的高度设置,可以让数据展示变得更加生动且具有更强的视觉冲击力。 ...
- 没有解决我的问题, 去提问

