写好类之后读写文件,再画图
class Base:
def __init__(self, name,age,sex):
self.name = name
self.age = age
self.sex = sex
class Score:
def __init__(self, math,chinese,english):
self.math = math
self.chinese = chinese
self.english = english
def totalScore(self):
return self.math + self.chinese + self.english
def avgScore(self):
return (self.math + self.chinese + self.english)/3
class Stu(Base):
def __init__(self, major,grade, name,age,sex,math,chinese,english):
super().__init__(name,age,sex)
self.major = major
self.grade = grade
self.score = Score(math,chinese,english)
s = []
with open("stuscore.txt","w") as f:
for i in range(8):
t=input()
t1=t.split(' ')
j=Stu(t1[0],t1[1],t1[2],t1[3],t1[4],t1[5],t1[6],t1[7])
s.append(j)
f.write(t)
f.write('\n')
with open("stuScorestat.txt", "w") as f:
m1,m2,m3,c1,c2,c3,e1,e2,e3,n1,n2,n3=0,0,0,0,0,0,0,0,0,0,0,0
for i in s:
if i.grade=='1':
m1+=int(i.score.math)
c1+=int(i.score.chinese)
e1+=int(i.score.english)
n1+=1
elif i.grade=='2':
m2+=int(i.score.math)
c2+=int(i.score.chinese)
e2+=int(i.score.english)
n2+=1
else:
m3+=int(i.score.math)
c3+=int(i.score.chinese)
e3+=int(i.score.english)
n3+=1
t='1'+','+str(round(m1/n1,2))+','+str(round(c1/n1,2))+','+str(round(e1/n1,2))
f.write(t)
f.write('\n')
t='2'+','+str(round(m2/n2,2))+','+str(round(c2/n2,2))+','+str(round(e2/n2,2))
f.write(t)
f.write('\n')
t='3'+','+str(round(m3/n3,2))+','+str(round(c3/n3,2))+','+str(round(e3/n3,2))
f.write(t)
f.write('\n')
s=[]
with open("stuScorestat.txt", "r") as f:
for i in f.readlines():
i=str(i).split('\n')[0]
s.append(i)
print(s)
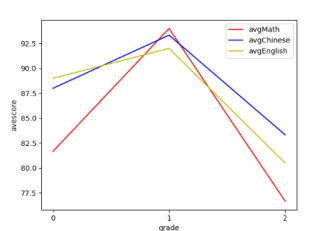
import matplotlib.pyplot as plt
x=['0','1','2']
y1=[float(s[0].split(',')[1]),float(s[0].split(',')[2]),float(s[0].split(',')[3])]
y2=[float(s[1].split(',')[1]),float(s[1].split(',')[2]),float(s[1].split(',')[3])]
y3=[float(s[2].split(',')[1]),float(s[2].split(',')[2]),float(s[2].split(',')[3])]
plt.plot(x,y1,label='avgMath',color='r')
plt.plot(x,y2,label='avgChinese',color='b')
plt.plot(x,y3,label='avgEnglish',color='y')
plt.xlabel('grade')
plt.ylabel('avescore')
plt.legend()
plt.savefig('1.png')
plt.show()
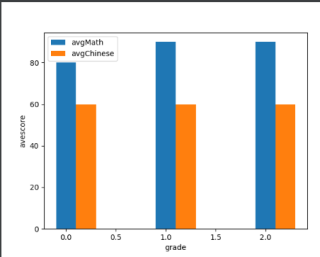
x=['0','1','2']
y1=[80,90,90]
y2=[60,60,60]
n1 = list(range(len(x)))
n2 = [i+0.2 for i in n1]
plt.bar(n1,y1,width=0.2,label='avgMath')
plt.bar(n2,y2,width=0.2,label='avgChinese')
plt.xlabel('grade')
plt.ylabel('avescore')
plt.legend()
plt.savefig('2.png')
plt.show()
'''
1 1 1 1 1 85 96 80
1 2 1 1 1 88 93 80
1 3 1 1 1 89 94 80
1 1 1 1 1 80 96 80
1 2 1 1 1 88 97 80
1 3 1 1 1 89 90 81
1 1 1 1 1 80 90 70
1 2 1 1 1 88 90 90
'''


