R语言画图,入门阶段,可能有很多低级错误
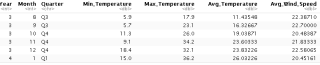
目前已经有了数据,
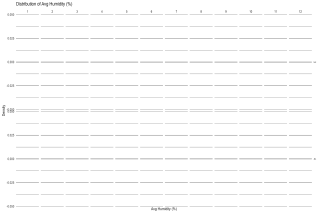
我使用如下代码再Rstudio作图
已经安装了install.packages("ggplot2")对应库文件,目前图片全都是空白的。
创造的distribution fuction如下
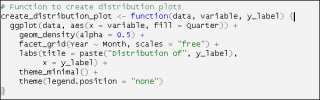
  FunctiontO           createdistributionplots
 create_distribution_plot<- function(data,variable,y_labe7
  ggplot(data,aes(x=variable,f177                                      Quarter         +
    geom_density(alpha=C                      0.5)+
    facet_gridCYear                  Month,sca72s             S=free+
   Tabs(title=paste(Distributionof",y_7abel),
        x=y_labe7)+
    theme_minimaTC+
    theme(Tegend.position                         "none"
这个是核心调用代码,这个调用的是上面图片里的函数
temperature_plot <- create_distribution_plot(temperature_data, summary_table$Min_Temperature, "Min Temperature (°C)")
ggsave("min_temperature_distribution.png", temperature_plot, width = 12, height = 8)