w_4419 2024-04-11 13:49 采纳率: 83.3%
浏览 3
已结题

mpandroidchart 实现多曲线参考线

img


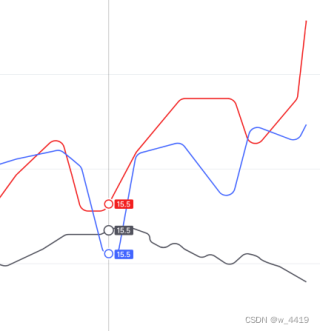
mpandroid 实现这个效果,下方代码内 垂直线的起始位置无法设置到 折线图y起始点到y最大值 ,园点无法同时在两条曲线上展示

public DashedLineMarkerView(Context context, int layoutResource, LineChart chart) {
        super(context, layoutResource);
        lineChart = chart;
        Paint dashedLinePaint = new Paint(Paint.ANTI_ALIAS_FLAG);
        dashedLinePaint.setStyle(Paint.Style.STROKE);
        dashedLinePaint.setColor(Color.BLACK);
        dashedLinePaint.setStrokeWidth(5f);
        textPaint = new Paint(Paint.ANTI_ALIAS_FLAG);
        textPaint.setColor(Color.BLACK);
        textPaint.setTextSize(12);
        circlePaint = new Paint(Paint.ANTI_ALIAS_FLAG);
        circlePaint.setStyle(Paint.Style.FILL);
        circlePaint.setColor(Color.WHITE);
        circleMaxPaint = new Paint(Paint.ANTI_ALIAS_FLAG);
        circleMaxPaint.setStyle(Paint.Style.FILL);
        circleMaxPaint.setColor(Color.RED);
    }
    @SuppressLint("SetTextI18n")
    @Override
    public void refreshContent(Entry e, Highlight highlight) {
        textView= findViewById(R.id.textView);
        if (e instanceof CandleEntry) {
            textView.setText("High: " + ((CandleEntry) e).getHigh());
        } else {
            textView.setText("Value: " + e.getY());
        }
        LineDataSet dataSet = (LineDataSet) lineChart.getLineData().getDataSetByIndex(0); // 假设这里是第一条曲线
        int entryCount = dataSet.getEntryCount();
        Entry lastEntry = dataSet.getEntryForIndex(entryCount - 1);
        // 设置 Marker 的位置为最近加入的数据点的位置
        double xPos = lineChart.getTransformer(YAxis.AxisDependency.LEFT).getPixelForValues(lastEntry.getX(), 0f).x;
        double yPos = lineChart.getTransformer(YAxis.AxisDependency.LEFT).getPixelForValues(0f, lastEntry.getY()).y;
        // 设置 Marker 的偏移量
        setOffset(-(getWidth() / 2), -getHeight());
        // 设置 Marker 的位置
//        setPosition(xPos, yPos);
        super.refreshContent(e, highlight);
    }

    @Override
    public void draw(Canvas canvas, float posX, float posY) {
//        canvas.drawLine(posX, 0f, posX, lineChart.getMeasuredHeight(), dashedLinePaint);
        canvas.drawCircle(posX, posY, 10f, circleMaxPaint);
        canvas.drawCircle(posX, posY, 5f, circlePaint);
        canvas.drawText(textView.getText().toString(), posX, posY - 10, textPaint);
        super.draw(canvas, posX, posY);
    }

  • 写回答

5条回答 默认 最新

  • Kwan的解忧杂货铺 Java领域优质创作者 2024-04-16 02:24
    关注

    上午好☀️☀️☀️️
    本答案参考ChatGPT-3.5

    针对你的问题,可以有以下解决方案:

    1. 设置垂直参考线的起始位置 可以利用线性图表组件(LineChart)提供的getAxisLeft()方法来获取Y轴对象,通过getAxisMinimum()方法获取Y轴的最小值,这样就可以将起始位置设置到折线图y起始点。代码如下:
    YAxis yAxis = lineChart.getAxisLeft();
    float minY = yAxis.getAxisMinimum();
    

    同时,需要在DashedLineMarkerView类中添加一个画笔,将该垂直线绘制出来。代码如下:

    Paint linePaint = new Paint(Paint.ANTI_ALIAS_FLAG);
    linePaint.setStyle(Paint.Style.STROKE);
    linePaint.setColor(Color.BLACK);
    linePaint.setStrokeWidth(2f);
    
    canvas.drawLine((float) xPos, minY, (float) xPos, posY, linePaint);
    
    1. 圆点同时在两条曲线上展示 可以通过在DashedLineMarkerView类中获取所在点的Entry对象的Y值,来将圆点同时绘制在两条曲线上。代码如下:
    // 假设有2条曲线
    LineDataSet dataSet1 = (LineDataSet) lineChart.getLineData().getDataSetByIndex(0);
    LineDataSet dataSet2 = (LineDataSet) lineChart.getLineData().getDataSetByIndex(1);
    
    // 在刷新 MarkerView 的时候,获取所在点的 Entry 对象,从而获取 Y 值
    Entry entry1 = dataSet1.getEntryForIndex((int) e.getX());
    Entry entry2 = dataSet2.getEntryForIndex((int) e.getX());
    float yValue1 = entry1.getY();
    float yValue2 = entry2.getY();
    
    // 将圆点同时绘制在两条曲线上
    float xPos = lineChart.getTransformer(YAxis.AxisDependency.LEFT).getPixelForValues(entry1.getX(), 0f).x;
    float yPos1 = lineChart.getTransformer(YAxis.AxisDependency.LEFT).getPixelForValues(0f, yValue1).y;
    float yPos2 = lineChart.getTransformer(YAxis.AxisDependency.LEFT).getPixelForValues(0f, yValue2).y;
    canvas.drawCircle(xPos, yPos1, 5f, circlePaint);
    canvas.drawCircle(xPos, yPos2, 5f, circlePaint);
    

    修改后的DashedLineMarkerView类代码如下:

    public class DashedLineMarkerView extends MarkerView {
    
        private TextView textView;
        private LineChart lineChart;
        private Paint textPaint, circlePaint, circleMaxPaint, linePaint;
    
        public DashedLineMarkerView(Context context, int layoutResource, LineChart chart) {
            super(context, layoutResource);
            lineChart = chart;
    
            textPaint = new Paint(Paint.ANTI_ALIAS_FLAG);
            textPaint.setColor(Color.BLACK);
            textPaint.setTextSize(12);
    
            circlePaint = new Paint(Paint.ANTI_ALIAS_FLAG);
            circlePaint.setStyle(Paint.Style.FILL);
            circlePaint.setColor(Color.WHITE);
    
            circleMaxPaint = new Paint(Paint.ANTI_ALIAS_FLAG);
            circleMaxPaint.setStyle(Paint.Style.FILL);
            circleMaxPaint.setColor(Color.RED);
    
            linePaint = new Paint(Paint.ANTI_ALIAS_FLAG);
            linePaint.setStyle(Paint.Style.STROKE);
            linePaint.setColor(Color.BLACK);
            linePaint.setStrokeWidth(2f);
            DashPathEffect dashPathEffect = new DashPathEffect(new float[]{10f, 10f}, 0f);
            linePaint.setPathEffect(dashPathEffect);
        }
    
        @SuppressLint("SetTextI18n")
        @Override
        public void refreshContent(Entry e, Highlight highlight) {
            textView = findViewById(R.id.textView);
            if (e instanceof CandleEntry) {
                textView.setText("High: " + ((CandleEntry) e).getHigh());
            } else {
                textView.setText("Value: " + e.getY());
            }
            super.refreshContent(e, highlight);
        }
    
        @Override
        public void draw(Canvas canvas, float posX, float posY) {
            // 绘制垂直参考线
            YAxis yAxis = lineChart.getAxisLeft();
            float minY = yAxis.getAxisMinimum();
            float xPos = lineChart.getTransformer(YAxis.AxisDependency.LEFT).getPixelForValues(((LineDataSet) lineChart.getLineData().getDataSets().get(0)).getEntryForIndex((int) getEntry().getX()).getX(), 0f).x;
            canvas.drawLine(xPos, minY, xPos, posY, linePaint);
    
            // 绘制圆点
            LineDataSet dataSet1 = (LineDataSet) lineChart.getLineData().getDataSetByIndex(0);
            LineDataSet dataSet2 = (LineDataSet) lineChart.getLineData().getDataSetByIndex(1);
            Entry entry1 = dataSet1.getEntryForIndex((int) getEntry().getX());
            Entry entry2 = dataSet2.getEntryForIndex((int) getEntry().getX());
            float yValue1 = entry1.getY();
            float yValue2 = entry2.getY();
            float yPos1 = lineChart.getTransformer(YAxis.AxisDependency.LEFT).getPixelForValues(0f, yValue1).y;
            float yPos2 = lineChart.getTransformer(YAxis.AxisDependency.LEFT).getPixelForValues(0f, yValue2).y;
            canvas.drawCircle(xPos, yPos1, 5f, circlePaint);
            canvas.drawCircle(xPos, yPos2, 5f, circlePaint);
    
            // 绘制弹出框中的文本
            canvas.drawText(textView.getText().toString(), xPos, posY - 10, textPaint);
            super.draw(canvas, posX, posY);
        }
    }
    
    本回答被题主选为最佳回答 , 对您是否有帮助呢?
    评论
查看更多回答(4条)

报告相同问题?

问题事件

  • 系统已结题 4月24日
  • 已采纳回答 4月16日
  • 创建了问题 4月11日

悬赏问题

  • ¥15 微信会员卡接入微信支付商户号收款
  • ¥15 如何获取烟草零售终端数据
  • ¥15 数学建模招标中位数问题
  • ¥15 phython路径名过长报错 不知道什么问题
  • ¥15 深度学习中模型转换该怎么实现
  • ¥15 HLs设计手写数字识别程序编译通不过
  • ¥15 Stata外部命令安装问题求帮助!
  • ¥15 从键盘随机输入A-H中的一串字符串,用七段数码管方法进行绘制。提交代码及运行截图。
  • ¥15 TYPCE母转母,插入认方向
  • ¥15 如何用python向钉钉机器人发送可以放大的图片?