大家帮我看一下用这段代码要生成这样的图片 怎么读取自己的图片啊


大家帮我看一下用这段代码要生成这样的图片 怎么读取自己的图片啊
 分享
分享
 关注
关注引自免费微信小程序:皆我百晓生
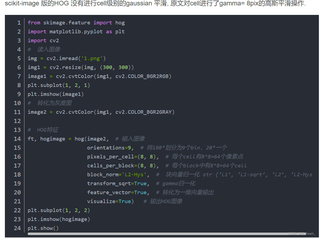
为了在 Python 中实现 HOG(Histogram of Oriented Gradients)特征图的可视化,你需要使用 OpenCV 和 scikit-image 库。首先确保你已经安装了这些库,如果没有,可以通过 pip 安装:
pip install opencv-python-headless scikit-image
然后,根据给定的代码片段,这里是一个详细的解释以及如何读取你自己的图片并生成 HOG 特征图的步骤:
以下是完整的代码示例,包括如何读取你自己的图片:
import cv2
import numpy as np
from skimage.feature import hog

def visualize_hog(image_path):
    # 读入图像
    img = cv2.imread(image_path)

    # 缩放图像(可选)
    img_resized = cv2.resize(img, (300, 300))

    # 将彩色图像转换为灰度图像
    image_gray = cv2.cvtColor(img_resized, cv2.COLOR_BGR2GRAY)

    # 计算 HOG 特征并生成可视化图像
    orientations = 9  # 将180°划分为9个bin,20°一个
    pixels_per_cell = (8, 8)  # 每个cell有8x8=64个像素点
    cells_per_block = (8, 8)  # 每个block中有8x8=64个cell
    block_norm = 'L2-Hys'  # 块向量归一化 str{'L1','L1-sqrt','L2','L2-Hys'}
    transform_sqrt = True  # gamma 归一化
    feature_vector = False  # 不转化为一维向量输出,保留原图可视化
    visualize = True  # 输出HOG图像

    hog_image = hog(image_gray, orientations, pixels_per_cell, cells_per_block,
                    block_norm, transform_sqrt, feature_vector, visualize)

    # 显示原始图片和 HOG 图像
    fig, axs = plt.subplots(1, 2, figsize=(10, 5))
    axs[0].imshow(cv2.cvtColor(img_resized, cv2.COLOR_BGR2RGB))
    axs[0].set_title('Original Image')
    axs[1].imshow(hog_image, cmap='gray')
    axs[1].set_title('HOG Visualization')
    plt.tight_layout()
    plt.show()

# 使用你自己的图片路径替换下面的路径
image_path = "path_to_your_image.png"
visualize_hog(image_path)
将 image_path 变量中的 "path_to_your_image.png" 替换为你想要分析的图片的实际路径。运行这段代码后,它会显示原始图像和对应的 HOG 特征图。注意,HOG 图像的颜色表示不同方向上的梯度强度,颜色越深,表示相应方向的梯度越强。
分享 已结题
(查看结题原因) 5月25日
赞助了问题酬金15元
5月25日
创建了问题
5月25日
已结题
(查看结题原因) 5月25日
赞助了问题酬金15元
5月25日
创建了问题
5月25日


