单细胞分析降维后legend不是按照正常顺序排列
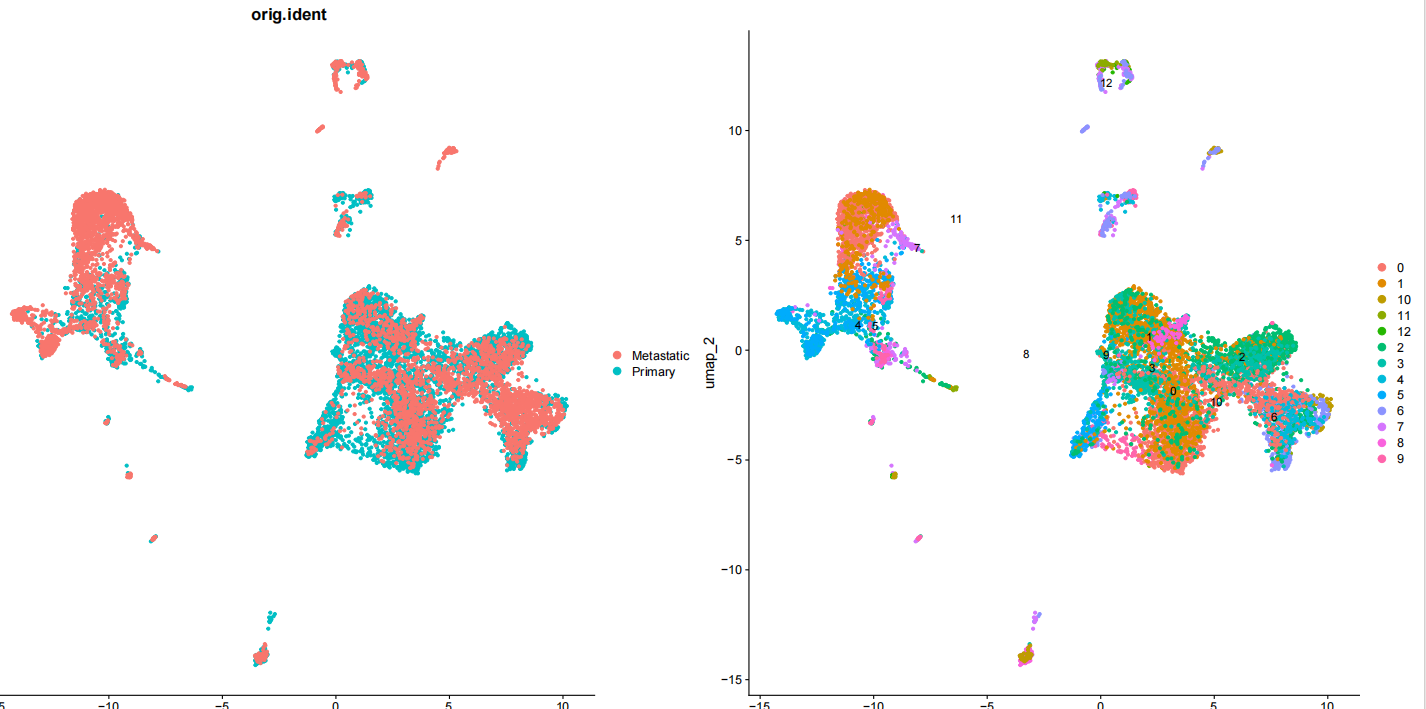
p1 <- DimPlot(object.combined, reduction = "umap", group.by = "orig.ident", pt.size = 1.0)
  p2 <- DimPlot(object.combined, reduction = "umap", label = T, pt.size = 1.0)
  p1 + p2
  dev.off()

单细胞分析降维后legend不是按照正常顺序排列
p1 <- DimPlot(object.combined, reduction = "umap", group.by = "orig.ident", pt.size = 1.0)
p2 <- DimPlot(object.combined, reduction = "umap", label = T, pt.size = 1.0)
p1 + p2
dev.off()
 分享
分享
阿里嘎多学长整理AIGC生成,因移动端显示问题导致当前答案未能完全显示,请使用PC端查看更加详细的解答过程
解决方案
该问题可能是由于 DimPlot 函数中 group.by 参数设置为 "orig.iden" 导致的。R 语言中,由于 orig.iden 的顺序与原有的顺序不一致,所以导致 legend 顺序混乱。
建议
可以尝试以下方法来解决这个问题:
group.by 参数设置为原有的条件变量,如 group.by = "celltype"(此处为示例,具体取决于你的数据)。DimPlot 函数可以正确地对 legend 进行排序。核心代码:
p1 <- DimPlot(object.combined, reduction = "umap", group.by = "celltype")
或者:
p1 <- DimPlot(object.combined, reduction = "umap", group.by = sort(object.combined[, "orig.iden"]))
 创建了问题
9月17日
创建了问题
9月17日

