晚上好🌙🌙🌙
本答案参考通义千问
在使用 ggsave() 保存 ggplot 图表时,如果出现错误,可能是由于以下几个原因引起的。下面我将逐步分析并提供解决方案。
1. 检查 ggsave() 的参数顺序
重点:ggsave() 的第一个参数应该是图形对象(如 p1),而不是文件名或尺寸。
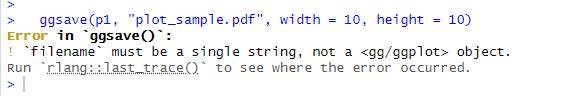
❌ 错误写法:
ggsave(p1, "plot_sample.pdf", width = 10, height = 10)
✅ 正确写法:
ggsave("plot_sample.pdf", plot = p1, width = 10, height = 10)
注意: 在较新的 ggplot2 版本中,ggsave() 的参数顺序可能有变化,建议明确指定 plot 参数。
2. 确保 p1 是一个有效的 ggplot 对象
确保 p1 已经正确生成,并且没有语法错误。例如:
sample_table 是否包含 Sample, CellNumber, celltype 列?RotatedAxis() 是否是自定义函数?是否已加载?
如果 RotatedAxis() 是来自某个包(如 ggpubr 或其他),请确认是否已经安装并加载了该包:
library(ggpubr) # 如果 RotatedAxis 来自 ggpubr
3. 检查 ggsave() 的输出路径和权限
确保你有权限在目标路径下保存文件。可以尝试将文件保存到当前工作目录,或者指定完整路径:
ggsave("~/Desktop/plot_sample.pdf", plot = p1, width = 10, height = 10)
4. 检查是否有缺失的依赖包
某些主题设置(如 element_rect、element_line)需要 ggplot2 和 grid 包的支持。确保这些包已安装并加载:
install.packages("ggplot2")
install.packages("grid")
library(ggplot2)
library(grid)
5. 完整的修改后代码示例
以下是修正后的代码:
# 加载必要的包
library(ggplot2)
library(grid)

# 假设 sample_table 是数据框,包含 Sample, CellNumber, celltype 列
# colour 是一个颜色向量,例如:colour <- c("red", "blue", "green")

# 创建图表
p1 <- ggplot(sample_table, aes(x = Sample, weight = CellNumber, fill = celltype)) +
  geom_bar(position = "fill") +
  scale_fill_manual(values = colour) +
  theme(
    panel.grid = element_blank(),
    panel.background = element_rect(fill = "transparent", colour = NA),
    axis.line.x = element_line(colour = "black"),
    axis.line.y = element_line(colour = "black"),
    plot.title = element_text(lineheight = .8, face = "bold", hjust = 0.5, size = 16)
  ) +
  labs(y = "Percentage") +
  RotatedAxis()  # 确保 RotatedAxis 已定义

# 保存图表
ggsave("plot_sample.pdf", plot = p1, width = 10, height = 10)
6. 常见错误及解决方法总结
| 错误信息 | 解决方案 |
|----------|----------|
| Error in ggsave(...): 'filename' must be a character string | 确保文件名是字符串(如 "plot.pdf") |
| Error in ggsave(...): 'plot' is missing | 明确指定 plot = p1 |
| Undefined function 'RotatedAxis' | 确保 RotatedAxis 函数可用或替换为 theme(axis.text.x = element_text(angle = 90)) |
| Permission denied | 更改保存路径为可写的目录 |
7. 替代方案:使用 pdf() 和 dev.off()
如果你仍然无法通过 ggsave() 保存图像,可以尝试使用 R 的基础绘图函数:
pdf("plot_sample.pdf", width = 10, height = 10)
print(p1)
dev.off()
总结
- 确保
ggsave() 的参数顺序正确,使用 plot = p1。 - 检查所有依赖项是否已加载,包括
RotatedAxis()。 - 确保有权限在目标路径下保存文件。
- 使用
pdf() 和 dev.off() 作为替代方法。
如有更多具体错误信息,请提供完整的错误提示,我可以进一步帮助你定位问题。