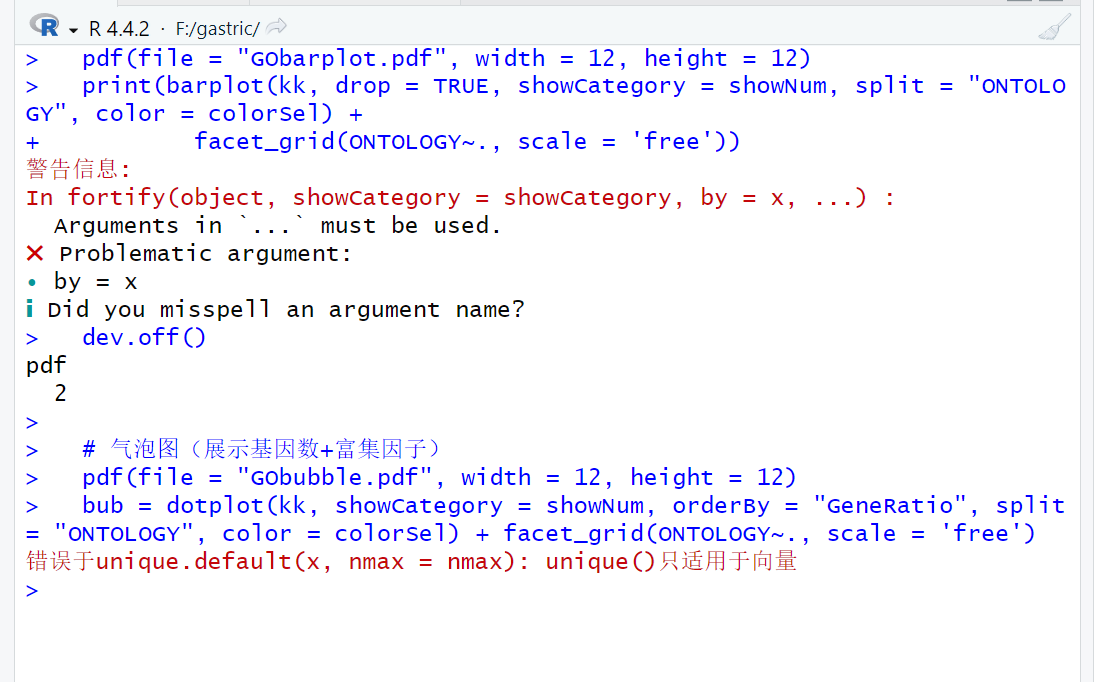
之前写的富集分析可视化代码,之前是可以正常运行的,为什么这次运行绘制气泡图的代码时会失败?
# ====================== 6. 模块3:GO富集分析(原逻辑无修改) ======================
write_log("========== 开始:GO富集分析(生物过程BP+细胞组分CC+分子功能MF) ==========")
write_log(paste("富集分析筛选阈值:p<", threshold$adj_pval, ",q<", threshold$adj_pval))
check_files(c("diff.txt")) # 检查差异基因文件是否存在
# 6.1 读取差异基因并转换为Entrez ID(clusterProfiler要求)
rt <- read.table("diff.txt", header = T, sep = "\t", check.names = F)
genes <- as.vector(rt[,1])
write_log(paste("输入GO富集分析的差异基因数:", length(genes)))
# 基因名→Entrez ID转换
entrezIDs <- as.character(mget(genes, org.Hs.egSYMBOL2EG, ifnotfound = NA))
gene <- entrezIDs[entrezIDs != "NA"]
na_gene <- sum(is.na(entrezIDs))
write_log(paste("基因名→Entrez ID转换:有效ID数", length(gene), ",无效/未注释ID数", na_gene))
if(length(gene)==0){
  write_log("错误:无有效Entrez ID,GO富集分析终止!")
  stop("无有效Entrez ID,无法进行GO富集分析")
}

# 6.2 GO富集分析(全本体:BP+CC+MF)
kk <- enrichGO(gene = gene, OrgDb = org.Hs.eg.db, pvalueCutoff = 1, qvalueCutoff = 1,
               ont = "all", readable = T) # 先不筛选,后续统一过滤
GO <- as.data.frame(kk)
# 筛选显著富集的GO条目
GO_sig <- GO[(GO$pvalue<threshold$adj_pval & GO$qvalue<threshold$adj_pval),]
write.table(GO_sig, file = "GO.txt", sep = "\t", quote = F, row.names  =  F)
write_log(paste("GO富集分析总条目数:", nrow(GO), ",显著富集条目数:", nrow(GO_sig)))
if(nrow(GO_sig)==0){
  write_log(paste("警告:无显著富集的GO条目(p<", threshold$adj_pval, ", q<", threshold$adj_pval, "),跳过GO可视化"))
}else{
  write_log(paste("输出GO显著富集结果:GO.txt(含本体、描述、基因数、p值、q值、核心基因)"))
  # 6.3 定义展示条目数(不足5个则展示全部)
  showNum <- if(nrow(GO_sig)<5) nrow(GO_sig) else 5
  colorSel <- if(threshold$adj_pval>0.05) "pvalue" else "qvalue" # 颜色依据:q值优先
  # 6.4 绘制GO可视化图:柱状图+气泡图(分本体展示)
  # 柱状图(展示富集因子)
  pdf(file = "GObarplot.pdf", width = 12, height = 12)
  print(barplot(kk, drop = TRUE, showCategory = showNum, split = "ONTOLOGY", color = colorSel) +
          facet_grid(ONTOLOGY~., scale = 'free'))
  dev.off()

  # 气泡图(展示基因数+富集因子)
  pdf(file = "GObubble.pdf", width = 12, height = 12)
  bub = dotplot(kk, showCategory = showNum, orderBy = "GeneRatio", split = "ONTOLOGY", color = colorSel) + facet_grid(ONTOLOGY~., scale = 'free')
  print(bub)
  dev.off()

  # 6.5 绘制GO圈图+聚类图(展示基因与GO条目的关联)
  go <- data.frame(Category=GO_sig$ONTOLOGY, ID=GO_sig$ID, Term=GO_sig$Description,
                   Genes = gsub("/", ", ", GO_sig$geneID), adj_pval = GO_sig$p.adjust)
  genelist <- data.frame(ID=rt$id, logFC=rt$logFC); row.names(genelist)=genelist[,1]
  circ <- circle_dat(go, genelist)
  # 定义展示数(不足则展示全部)
  termNum <- if(nrow(go)<8) nrow(go) else 8
  geneNum <- if(nrow(genelist)<200) nrow(genelist) else 200
  chord <- chord_dat(circ, genelist[1:geneNum,], go$Term[1:termNum])
  # 圈图(基因-GO条目关联)
  pdf(file="GOcircos.pdf", width=10, height=10)
  GOChord(chord, space = 0.001, gene.order = 'logFC', gene.space = 0.25,
          gene.size = 5, border.size = 0.1, process.label = 6)
  dev.off()
  # 聚类图(基因表达与GO条目聚类)
  pdf(file="GOcluster.pdf",width=12, height=10)
  GOCluster(circ, go$Term[1:termNum], lfc.space = 0.2, lfc.width = 1,
            term.space = 0.2, term.width = 1)
  dev.off()
  write_log(paste("绘制GO富集圈图:GOcircos.pdf(展示前", termNum, "个GO条目与", geneNum, "个基因的关联)"))
  write_log(paste("绘制GO富集聚类图:GOcluster.pdf(展示基因logFC与GO条目的聚类关系)"))
}
write_log("========== 完成:GO富集分析 ==========\n")