做cellchat画图时自环的角度颠倒,如何解决,cellchat版本为2.2,ggplot2为4.0.2
library(CellChat)
data.input <- LayerData(scRNA.tumor, layer = "data")
identity <- subset(scRNA.tumor@meta.data, select = c("celltype.4","orig.ident"))
colnames(identity) <- c("celltype.4", "samples")
identity$samples <- factor(identity$samples)
# 创建cellchat对象
cellchat <- createCellChat(object = data.input,
meta = identity,
group.by = "celltype.4")
# 可选CellChatDB.human(人类配体-受体知识库), CellChatDB.mouse
CellChatDB <- CellChatDB.human
# 查看可以选择的interaction的类型标签
unique(CellChatDB$interaction$annotation)
# 画数据库分类统计图(主要用于了解数据库构成)
showDatabaseCategory(CellChatDB)
# 把选定的数据库写入对象
cellchat@DB <- CellChatDB
# 将信号基因的表达数据进行子集化,只保留信号相关基因,以节省计算成本
cellchat <- subsetData(cellchat)
# 计算策略改串联,之前用的8核并行报错(内存可能不够)
future::plan("sequential")
# 识别过表达基因
cellchat <- identifyOverExpressedGenes(cellchat,
thresh.pc = 0.05, # 一个基因在某细胞群中,至少有 5% 的细胞表达
thresh.fc = 0.0, # 不要求fold-change(差异倍数),只要满足其它条件就保留
thresh.p = 0.05
)
# 识别过表达配体-受体对
cellchat <- identifyOverExpressedInteractions(cellchat)
##相互作用推断
# 计算通信概率推断细胞互作的通信网络,每个LR的“通信概率/强度”
cellchat <- computeCommunProb(cellchat, raw.use = T) # 用原始表达(counts)或更接近原始的层
# 如果特定细胞群中只有少数细胞,则过滤掉细胞间的通信,celltype少于3个细胞则会被过滤
cellchat <- filterCommunication(cellchat, min.cells = 3)
# 提取推断出的细胞互作的通信网络数据框,我们提供了一个subsetCommunication 函数,
# 可以方便地访问感兴趣的推断的细胞间通信。
# 返回一个数据框,包含所有推断的配体/受体级别的细胞-细胞通信。
# 设置slot.name = "netP"以访问信令路径级别的推断通信
df.net.1 <- subsetCommunication(cellchat, slot.name = "netP")# 提取通路层面的通信
df.net.2 <- subsetCommunication(cellchat )
## 提取
levels(cellchat@idents)
##2、在信号通路水平上推断细胞间的通讯
cellchat <- computeCommunProbPathway(cellchat)
# 汇总通信概率来计算细胞间的聚合通信网络。
cellchat <- aggregateNet(cellchat)
##3、计算聚合细胞互作通信网络
groupSize <- as.numeric(table(cellchat@idents))
par(mfrow = c(1,2), xpd=TRUE) # xpd允许绘图超出绘图区边界
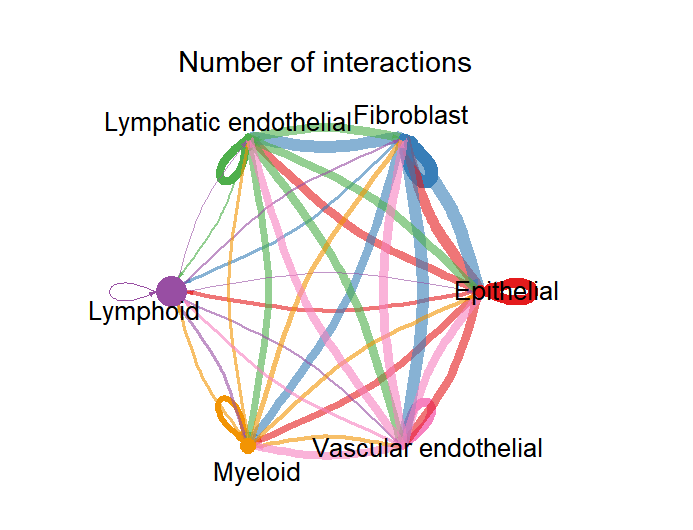
netVisual_circle(cellchat@net$count,
vertex.weight = groupSize, # 节点大小 ∝ 细胞数
weight.scale = T, # 把边权重做缩放映射到边宽
label.edge= F, # 不在边上写数值
title.name = "Number of interactions")
netVisual_circle(cellchat@net$weight,
vertex.weight = groupSize,
weight.scale = T,
label.edge= F,
title.name = "Interaction weights/strength")