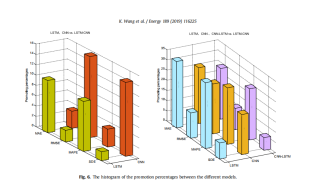
小弟现在的模型结果都有了,想画一个3D的图来比较各个模型之间的性能,但是不知道怎么画。求大佬指点。
 标题
标题

小弟现在的模型结果都有了,想画一个3D的图来比较各个模型之间的性能,但是不知道怎么画。求大佬指点。
标题
 分享
分享
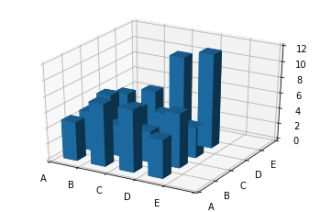
设置下 plt.xticks() 和plt.yticks(), 比如官网的案例, 增加两句代码:
import matplotlib.pyplot as plt
import numpy as np

# Fixing random state for reproducibility
np.random.seed(19680801)


fig = plt.figure()
ax = fig.add_subplot(projection='3d')
x, y = np.random.rand(2, 100) * 4
hist, xedges, yedges = np.histogram2d(x, y, bins=4, range=[[0, 4], [0, 4]])

# Construct arrays for the anchor positions of the 16 bars.
xpos, ypos = np.meshgrid(xedges[:-1] + 0.25, yedges[:-1] + 0.25, indexing="ij")
xpos = xpos.ravel()
ypos = ypos.ravel()
zpos = 0

# Construct arrays with the dimensions for the 16 bars.
dx = dy = 0.5 * np.ones_like(zpos)
dz = hist.ravel()

ax.bar3d(xpos, ypos, zpos, dx, dy, dz, zsort='average')
# 添加两句
plt.xticks([0,1,2,3,4,5],['A','B','C','D','E'])
plt.yticks([0,1,2,3,4,5],['A','B','C','D','E'])

plt.show()
也可以试试pyechart, 效果更好
分享


