
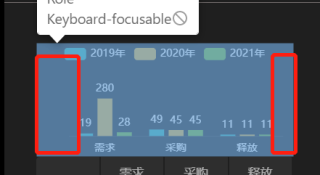
echatrs 柱状图取消了y轴之后仍然出现占位现象,怎么处理能够使 柱状图居中显示
代码如下:
       getOption=()=>{
        let option = {
            title: {//图表标题
                left:'center',
                textStyle: {
                    fontSize:14,
                    color: '#FFF',
                }
            },
            legend: {//示例图
                data: ['2019年','2020年','2021年'],
                top:0,
                textStyle: {
                    color: '#FFF',
                    color: 'rgba(255, 255, 255, .65)'
                }
            },
            grid: {//调整整个图表的位置
                left: '3%',
                right: '4%',
                bottom: '3%',
                containLabel: true
            },
            color:['#30B2AD','#E8B339','#74B72D'],
            xAxis: {
                type: 'category',
                data:["需求","采购","释放"],
                axisLabel: {//修改刻度文字颜色
                    color: 'rgba(255, 255, 255, .65)',
                    interval:0,
                 },
                splitLine:{//不显示背景线条
                    show:false,
                },
                axisTick:{//不显示刻度
                    show:false,
                },
            },
            yAxis: {
                type: 'value',
                show:false,
                axisLabel: {
                    // color: '#FFF',
                    axisLabel : {
                        formatter: function(){
                            return "";
                        }
                    }
                },
            },
            series: [
                {
                    name: '2019年',
                    type: 'bar',
                    emphasis: {
                        focus: 'series'
                    },
                    data: ['19','49','11'],
                    barCategoryGap:20,//设置同一系列的柱间距离,默认为类目间距
                    barMaxWidth:28,
                    itemStyle: {
                        normal: {
                            label: {//显示数据
                                show: true,
                                color: "#fff",
                                position:"top",
                                fontSize:"10px",
                            }
                        }
                    },
                },
                {
                    name: '2020年',
                    type: 'bar',
                    emphasis: {
                        focus: 'series'
                    },
                    data: ['280','45','11'],
                    barCategoryGap:20,//设置同一系列的柱间距离,默认为类目间距
                    barMaxWidth:28,
                    itemStyle: {
                        normal: {
                            label: {//显示数据
                                show: true,
                                color: "#fff",
                                position:"top",
                                fontSize:"10px",
                            }

                        }
                    },
                },
                {
                    name: '2021年',
                    type: 'bar',
                    emphasis: {
                        focus: 'series'
                    },
                    data: ['28','45','11'],
                    barCategoryGap:20,//设置同一系列的柱间距离,默认为类目间距
                    barMaxWidth:28,
                    itemStyle: {
                        normal: {
                            label: {//显示数据
                                show: true,
                                color: "#fff",
                                position:"top",
                                fontSize:"10px",
                            }

                        }
                    },
                }
            ]
        }
        return option
    }


