问题遇到的现象和发生背景
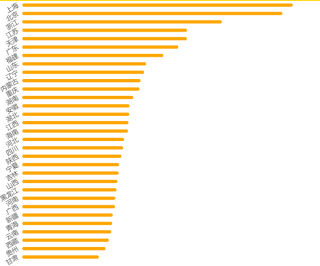
div的柱状图中y轴数值显示不全,bar的间距无法调整
遇到的现象和发生背景,请写出第一个错误信息
用代码块功能插入代码,请勿粘贴截图。 不用代码块回答率下降 50%
function echarts_2() {
var myChart = echarts.init(document.getElementById('echart2'));
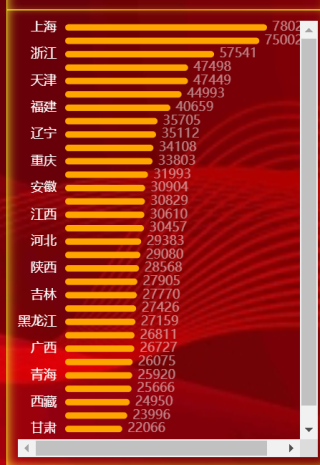
var data = [78027, 75002, 57541, 47498, 47449, 44993, 40659, 35705, 35112, 34108, 33803, 31993, 30904,30829,30610,30457,29383,29080,28568,27905,27770,27426,27159,26811,26727,26075,25920,25666,24950,23996,22066];
var titlename = ['上海', '北京', '浙江', '江苏', '天津', '广东', '福建', '山东', '辽宁', '内蒙古', '重庆', '湖南', '安徽','湖北','江西','海南','河北','四川','陕西','宁夏','吉林','山西','黑龙江','河南','广西','新疆','青海','云南','西藏','贵州','甘肃'];
option = {
grid: {
left: '0',
top:'0',
right: '0',
bottom: '0%',
containLabel: true
},
xAxis: {
show: false
},
yAxis: [{
show: true,
data: titlename,
inverse: true,
axisLine: { show: false},
splitLine:{ show: false},
axisTick:{ show: false},
axisLabel: {
textStyle: {
color:'#fff'
},
},
}, {
show: false,
inverse: true,
data: data,
axisLabel: {textStyle: {color: '#fff'}},
axisLine: { show: false},
splitLine:{ show: false},
axisTick: { show: false},
}],
series: [{
name: '条',
type: 'bar',
yAxisIndex: 0,
data: data,
barWidth: 6,
barGap:10,
itemStyle: {
normal: {
barBorderRadius: 50,
color:'#ffa500',
}
},
label: {
normal: {
show: true,
position: 'right',
formatter: '{c}',
textStyle: {color: 'rgba(255,255,255,.5)'}
}
},
}]
};
// 使用刚指定的配置项和数据显示图表。
myChart.setOption(option);
window.addEventListener("resize",function(){
myChart.resize();
});
}
运行结果及详细报错内容
我的解答思路和尝试过的方法,不写自己思路的,回答率下降 60%
使用barGap调整bar间距,但并没有效果
我想要达到的结果,如果你需要快速回答,请尝试 “付费悬赏”
bar之间有合适的距离的前提下,31个省份的文字都显示出来