使用Echart写数据视图(饼状图),写完测试没有问题,一部署到线上环境title就不显示了,中心成了空白,求原因
            tubiaoTherrTopOne() {
                let myChart = this.$echarts.init(document.getElementById('tubiaoTherrTopOne'));
                let option = {
                    tooltip: {
                        trigger: 'item'
                    },
                    color: ["#4a60ce"],
                    graphic: {
                        type: "text",
                        left: "center",
                        top: "48%",
                        style: {
                            text: "总数量",
                            textAlign: "center",
                            fill: "#4a60ce",
                            fontSize: 12,
                            fontWeight: 700
                        }
                    },
                    legend: {
                        top: '5%',
                        left: 'center'
                    },
                    series: [{
                        name: '总数量',
                        type: 'pie',
                        radius: ['50%', '55%'],
                        avoidLabelOverlap: false,
                        label: {
                            show: false,
                            position: 'center'
                        },
                        emphasis: {
                            label: {
                                show: true,
                                fontSize: '40',
                                fontWeight: 'bold'
                            }
                        },
                        labelLine: {
                            show: false
                        },
                        data: [{ value: this.bztL } ]
                    }]
                };
                myChart.setOption(option); //绘制
                window.addEventListener("resize", () => {
                    myChart.resize();
                });
            },
这张图片是线下测试的图片
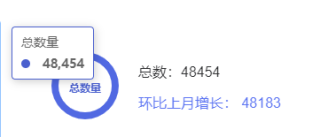
这张是部署后的图片