
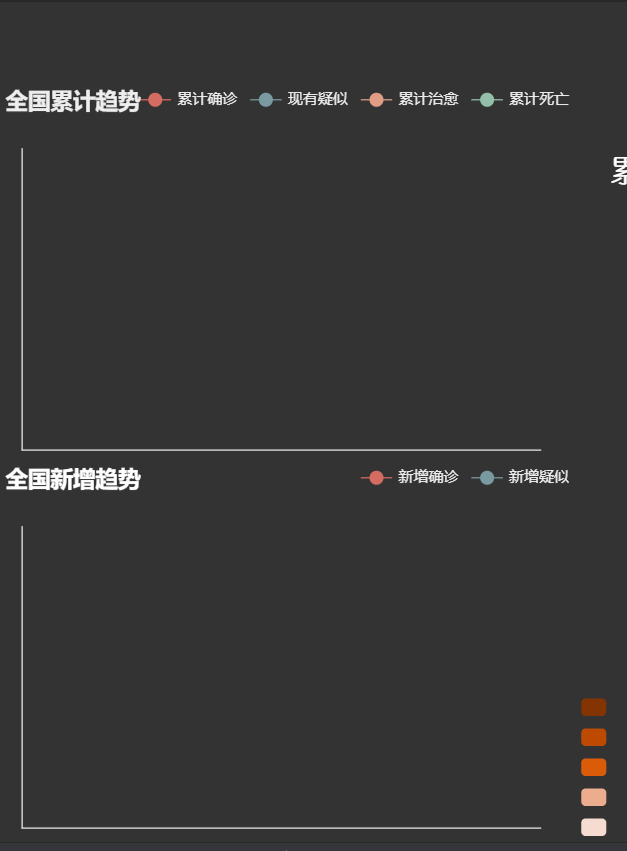
option在echarts官网可以正确显示,数据库数据也能正确输出,但是数据链接不知道哪里出了问题,曲线一直不能显示出来,也没有报错
@app.route('/l1')
def get_l1_data():
    data_l1 = utils.get_l1_data()
    day, confirm, suspect, heal, dead = [], [], [], [], []
    for a,b,c,d,e in data_l1[7:]:
        day.append(a.strftime("%m-%d"))
        confirm.append(b)
        suspect.append(c)
        heal.append(d)
        dead.append(e)
    return jsonify({"day":day, "confirm":confirm, "suspect":suspect, "heal": heal, "dead":dead})
function get_l1_data() {
    $.ajax({
        url:"/l1",
        success: function(data) {
            ec_left1_Option.xAxis.data=data.day;
            ec_left1_Option.series[0].data=data.confirm;
            ec_left1_Option.series[1].data=data.suspect;
            ec_left1_Option.series[2].data=data.heal;
            ec_left1_Option.series[3].data=data.dead;
            // ec_left1_Option.clear();
            ec_left1.setOption(ec_left1_Option, true)
        },
        error: function(xhr, type, errorThrown) {

        }
    })
}
var ec_left1 = echarts.init(document.getElementById('l1'), "dark");
var ec_left1_Option = {
    //标题样式
    title: {
        text: "全国累计趋势",
        textStyle: {
            // color: 'white',
        },
        left: 'left'
    },
    tooltip: {
        trigger: 'axis',
        //指示器
        axisPointer: {
            type: 'line',
            lineStyle: {
                color: '#7171C6'
            }
        }
    },
    legend: {
        data: ['累计确诊', '现有疑似', "累计治愈", "累计死亡"],
        left: "right"
    },

    //图形位置
    grid: {
        left: '4%',
        right: '6%',
        bottom: '4%',
        top: 50,
        containLabel: true
    },
    xAxis: [{
        type: 'category',
        //x轴坐标点开始与结束点位置都不在最边缘
        // boundaryGap : true,
        data:[]
    }],
    yAxis: [{
        type: 'value',
        //y轴字体设置
        axisLabel: {
            show: true,
            color: 'white',
            fontSize: 12,
            formatter: function(value) {
                if (value >= 1000) {
                    value = value / 1000 + 'k';
                }
                return value;
            }
        },
        //y轴线设置显示
        axisLine: {
            show: true
        },
        //与x轴平行的线样式
        splitLine: {
            show: true,
            lineStyle: {
                color: '#17273B',
                width: 1,
                type: 'solid'
            }
        }
    }],
    series: [{
        name: "累计确诊",
        type: 'line',
        smooth: true,
        data:[]
    }, {
        name: "现有疑似",
        type: 'line',
        smooth: true,
        data:[]
    },
        {
        name: "累计治愈",
        type: 'line',
        smooth: true,
        data:[]
    }, {
        name: "累计死亡",
        type: 'line',
        smooth: true,
        data:[]
    }]
};
// ec_left1.clear();
ec_left1.setOption(ec_left1_Option, true);


