

showchart() {
riverChart()
.then((res) => {
this.dateTime = res[0];
this.ql = res[1];
this.wrz = res[2];
this.zl == res[3];
console.log(this.dateTime)
console.log(this.ql)
})
.catch((error) => {
this.$message.error(error);
});
this.chartLine = echarts.init(document.getElementById("chartLineBox"));
var option = {
title: {
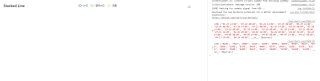
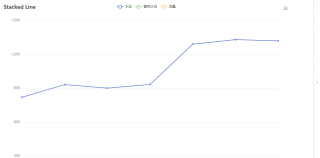
text: "Stacked Line",
},
tooltip: {
trigger: "axis",
},
legend: {
data: ["水位", "警戒水位", "流量"],
},
grid: {
left: "3%",
right: "4%",
bottom: "3%",
containLabel: true,
},
toolbox: {
feature: {
saveAsImage: {},
},
},
xAxis: {
type: "category",
boundaryGap: false,
data: this.dateTime,
},
yAxis: {
type: "value",
},
series: [
{
name: "水位",
data: this.zl,
type: "line",
stack: "Total",
},
{
name: "警戒水位",
data: this.wrz,
type: "line",
stack: "Total",
},
{
name: "流量",
data: this.ql,
type: "line",
stack: "Total",
},
],
};
this.chartLine.setOption(option);
},
使用从后端获取的数据,折线图不显示,使用直接写的一个数组数据显示,这是为什么呀?


