各位大神好,本人R语言shiny新手,最近在写一个APP,但是报错说reactive实施不了,麻烦各位帮忙看一下。
这个APP的功能是选择不同的学校后,会有不同的PC scores以及相关的关系图。
这是我之前用正常的R代码测试了一下,改变学校完全没有问题,但是用shiny就不行了
# Read the data
temp <- tempfile()
download.file("http://archive.ics.uci.edu/ml/machine-learning-databases/00356/student.zip",temp, mode="wb")
unzip(temp, "student-mat.csv")
math <- read.table("student-mat.csv",sep= ";", header= T)
unlink(temp)
(math <- as_tibble(math))

# Read the data for school "GP"
math.GP <- read.table("student-mat.csv",sep= ";", header= T) %>% filter(school == "GP")


# PCA Scores
PCs <- prcomp(select(math.GP, G3, G1, G2, absences, studytime),
              center = TRUE, scale = TRUE)
PCs

# Biplot
biplot(PCs, xlabs = rep(".", nrow(math.GP)), cex = 1.2)

# Screeplot
screeplot(PCs, type = "lines")

# Explained Proportion VS Cum. Proportion
par(mfrow = c(1, 2))
plot(PCs$sdev^2/sum(PCs$sdev^2), xlab = "Principal Component",
         ylab = "Proportion of Variance Explained", ylim = c(0, 1), type = 'b')
plot(cumsum(PCs$sdev^2/sum(PCs$sdev^2)), xlab = "Principal Component",
ylab = "Cum. Prop of Variance Explained", ylim = c(0, 1), type = 'b')

# Read the data for school "GP"

math.MS <- read.table("student-mat.csv",sep= ";", header= T) %>% filter(school == "MS")
head(math)
# PC Scores
PCs <- prcomp(select(math.MS, G3, G1, G2, absences, studytime), center = TRUE, scale = TRUE)
PCs


# Biplot
biplot(PCs, xlabs = rep(".", nrow(math.MS)), cex = 1.2)

# Screeplot
screeplot(PCs, type = "lines")
par(mfrow = c(1, 2))
plot(PCs$sdev^2/sum(PCs$sdev^2), xlab = "Principal Component",
         ylab = "Proportion of Variance Explained", ylim = c(0, 1), type = 'b')
plot(cumsum(PCs$sdev^2/sum(PCs$sdev^2)), xlab = "Principal Component",
ylab = "Cum. Prop of Variance Explained", ylim = c(0, 1), type = 'b')
这是我的shiny代码:
library(shiny)
library(shinythemes)

temp <- tempfile()
download.file("http://archive.ics.uci.edu/ml/machine-learning-databases/00356/student.zip",temp, mode="wb")
unzip(temp, "student-mat.csv")
math <- read.table("student-mat.csv",sep= ";", header= T)
unlink(temp)
(math <- as_tibble(math))


shinyUI(fluidPage(
        headerPanel(h1("PRINCIPLE COMPONENT ANALYSIS")),

        # Sidebar with options for the two schools
        sidebarLayout(
          sidebarPanel(
            h3("Select the Schools:"),
            selectizeInput("school", "School", selected = "GP",
                           choices = levels(as.factor(math$school)))
          ),
          mainPanel(
            tabsetPanel(

              tabPanel("PC_Scores",verbatimTextOutput("scores")),
              tabPanel("PC_Scree_PLot",plotOutput("screePlot")),
              tabPanel("Bi_Plot",plotOutput("biplot")),
              tabPanel("Proportion of Variance Explained vs
                               Cum. Proportion of Variance Explained"),
              plotOutput("explain"))

          )))
)


library(shiny)
library(dplyr)

temp <- tempfile()
download.file("http://archive.ics.uci.edu/ml/machine-learning-databases/00356/student.zip",temp, mode="wb")
unzip(temp, "student-mat.csv")
math <- read.table("student-mat.csv",sep= ";", header= T)
unlink(temp)
(math <- as_tibble(math))


shinyServer(function(input,output,session) {

  math <- reactive({
    newDat <- math %>% filter(school == input$school) %>%
      select(G1, G2, G3, absences, studytime)
  })


  output$scores <- renderPrint({
    X <- math()
    pca <- princomp(X, center = TRUE, scale = TRUE)
    pca$scores
  })

  output$screeplot<-renderPlot(
    {
      data <- math()
      dat <- princomp(data, center = TRUE, scale = TRUE)
      screeplot(dat, type = "lines")
    })

  output$biplot<-renderPlot(
    {
      data <- math()
      dat <- princomp(data, center = TRUE, scale = TRUE)
      biplot(dat, xlabs = rep(".", nrow(data)), cex = 1.2)
    })

  output$explain <- renderPlot(
    {
      data <- math()
      dat <- princomp(data, center = TRUE, scale = TRUE)
      par(mfrow = c(1, 2))
      plot(dat$sdev^2/sum(PCs$sdev^2), xlab = "Principal Component",
           ylab = "Proportion of Variance Explained", ylim = c(0, 1), type = 'b')
      plot(cumsum(dat$sdev^2/sum(PCs$sdev^2)), xlab = "Principal Component",
           ylab = "Cum. Prop of Variance Explained", ylim = c(0, 1), type = 'b')
    })


})
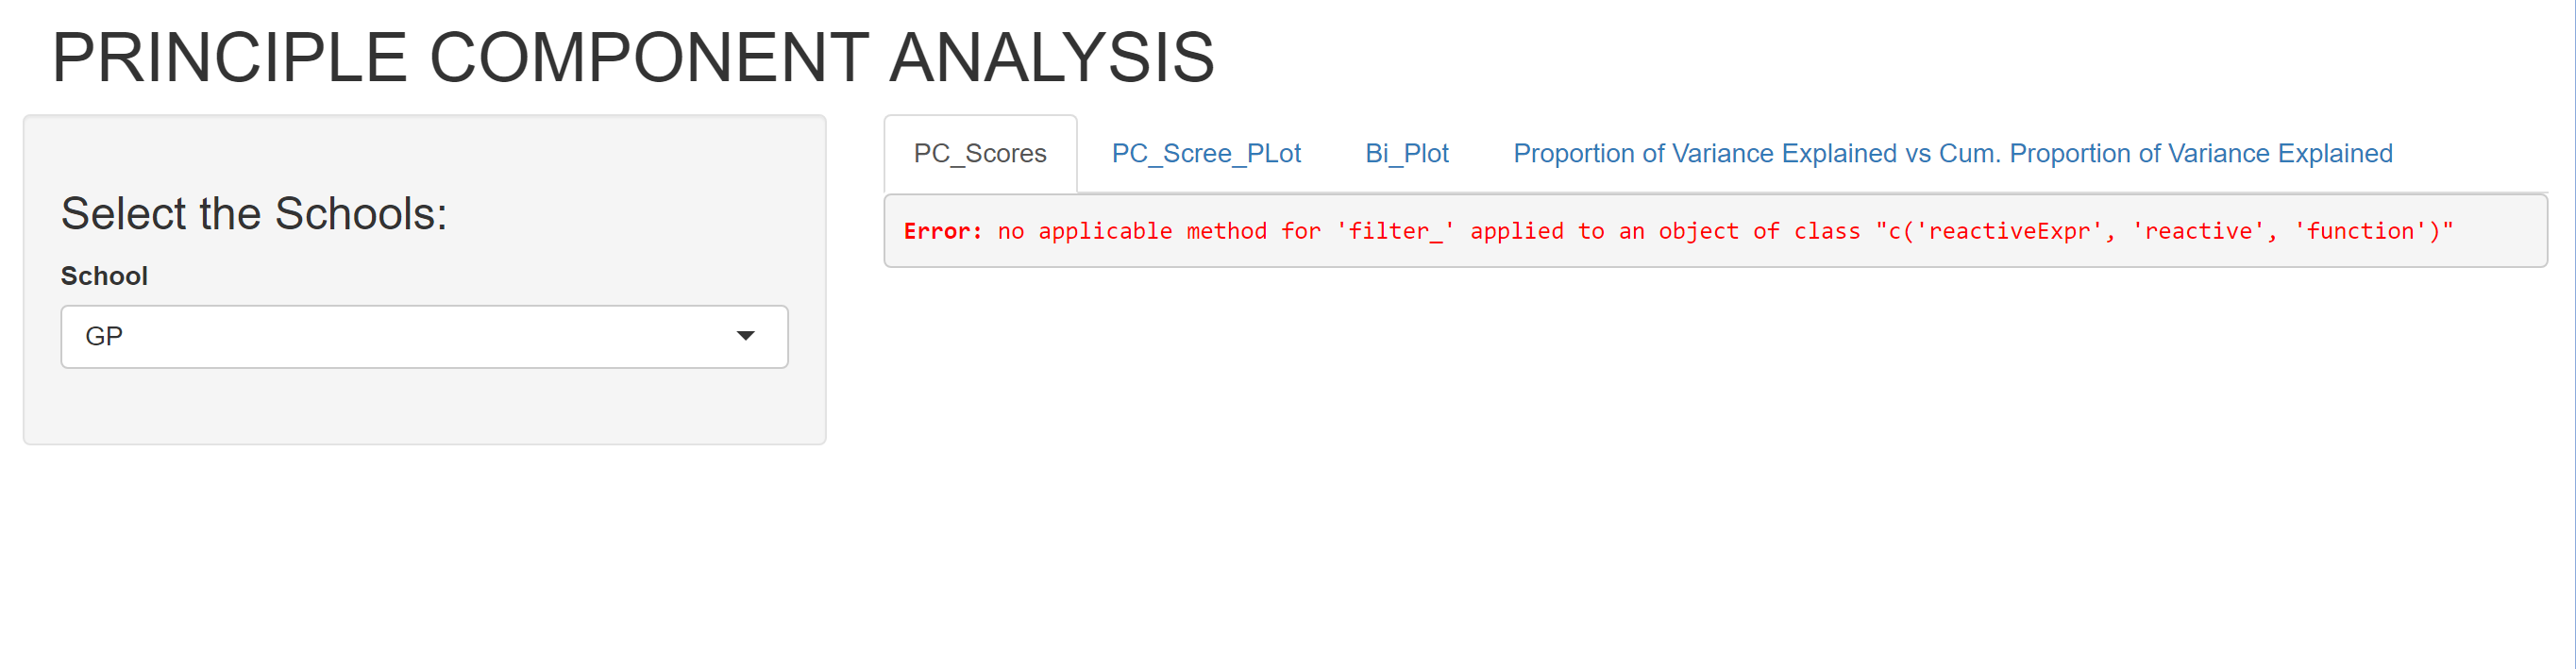
这是报错截图,万分感激大神们的帮助!