我脾气呢 2020-08-06 16:31 采纳率: 0%
浏览 4314

echarts中markLine属性配置了不显示是为什么?

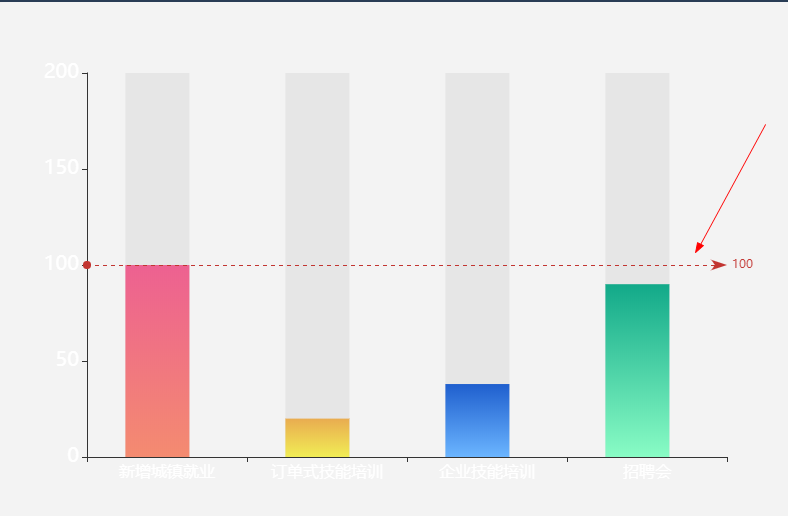
设置markLine属性不显示 怎么操作都没得显示

let option = {
            tooltip: {
                trigger: 'axis',
                axisPointer: {
                    // 坐标轴指示器,坐标轴触发有效
                    type: 'none', // 默认为直线,可选为:'line' | 'shadow'
                },
                formatter: function(params, ticket, callback) {
                    console.log(
                        'enterpriseCountValue/enterpriseTargetCountValue',
                        enterpriseCountValue / enterpriseTargetCountValue,
                    );

                    console.log('params', params);
                    return params[0].value
                        ? `<div style="text-align: left">
                    <div>${params[0].name}</div>
                    <div>已完成:${Math.floor(
                        (params[0].value * params[1].value) / 100,
                    )}</div>
                     <div>目标:${params[1].value}</div>
                  </div><br/>`
                        : '没有值';
                },
            },
            xAxis: {
                type: 'category',
                data: [
                    '新增城镇就业',
                    '订单式技能培训',
                    '企业技能培训',
                    '招聘会',
                ],
                axisLabel: {
                    show: true,
                    textStyle: {
                        color: 'white', //更改坐标轴文字颜色
                        fontSize: 16, //更改坐标轴文字大小
                    },
                },
            },
            yAxis: [{
                type: 'value',
                // scale: true,
                max: 200, //设置最大值
                min: 0,
                splitLine:{
                    show:false
                },
                // minorTick: {
                //     show: true
                // },
                // minorSplitLine: {
                //     show: true
                // },
                boundaryGap: [0.05, 0.05],
                axisLabel: {
                    show: true,
                    textStyle: {
                        color: 'white', //更改坐标轴文字颜色
                        fontSize: 20, //更改坐标轴文字大小
                    },
                    // interval: 'auto',
                    // formatter: '{value} %',
                },
            },
                ],
            series: [
                {
                    name: '已完成',
                    data: [
                        (yearCountValue / yearCountTargetValue) * 100,
                        (enterpriseCountValue / enterpriseTargetCountValue) * 100,
                        (orderCountValue / orderCountTargetValue) * 100,
                        (jobCountValue / jobCountTargetValue) * 100,
                    ],
                    markLine: {
                        data: [{
                            // yAxis:(yearCountValue/yearCountValue)*100
                            yAxis:100
                        }],
                    },
                    type: 'bar',
                    barWidth: '40%',
                    showBackground: true,
                    itemStyle: {
                        normal: {
                            color: function(params) {
                                const colorList = [
                                    ['#ED6191', '#F48B70'],
                                    ['#E9AC50', '#F1ED55'],
                                    ['#1F5FCE', '#6BB5FF'],
                                    ['#12A989', '#89FCC5'],
                                ];

                                var index = params.dataIndex;
                                if (params.dataIndex >= colorList.length) {
                                    index = params.dataIndex - colorList.length;
                                }

                                return new echarts.graphic.LinearGradient(
                                    0,
                                    0,
                                    0,
                                    1,
                                    [
                                        {
                                            offset: 0,
                                            color: colorList[index][0],
                                        },
                                        {
                                            offset: 1,
                                            color: colorList[index][1],
                                        },
                                    ],
                                );
                            },
                        },
                    },
                    // backgroundStyle: {
                    //     color: 'rgba(220, 220, 220, 0.8)'
                    // }


                },
                {
                    name: '目标',
                    data: [
                        yearCountTargetValue,
                        enterpriseTargetCountValue,
                        orderCountTargetValue,
                        jobCountTargetValue,
                    ],
                    type: 'bar',

                },

            ],
        };
  • 写回答

2条回答 默认 最新

  • jingluan666 2020-08-06 17:53
    关注

    是不是值过大导致没显示,我把你的代码的变量替换成固定值是显示的,在https://echarts.apache.org/examples/zh/editor.html?c=line-simple
    中运行的

    option = {
                tooltip: {
                    trigger: 'axis',
                    axisPointer: {
                        // 坐标轴指示器,坐标轴触发有效
                        type: 'none', // 默认为直线,可选为:'line' | 'shadow'
                    },
                    formatter: function(params, ticket, callback) {
                       console.log('params', params);
                       return params[0].value
                            ? `<div style="text-align: left">
                        <div>${params[0].name}</div>
                        <div>已完成:${Math.floor(
                            (params[0].value * params[1].value) / 100,
                        )}</div>
                         <div>目标:${params[1].value}</div>
                      </div><br/>`
                            : '没有值';
    
                    },
                },
                xAxis: {
                    type: 'category',
                    data: [
                        '新增城镇就业',
                        '订单式技能培训',
                        '企业技能培训',
                        '招聘会',
                    ],
                    axisLabel: {
                        show: true,
                        textStyle: {
                            color: 'white', //更改坐标轴文字颜色
                            fontSize: 16, //更改坐标轴文字大小
                        },
                    },
                },
                yAxis: [{
                    type: 'value',
                    // scale: true,
                    max: 200, //设置最大值
                    min: 0,
                    splitLine:{
                        show:false
                    },
                    // minorTick: {
                    //     show: true
                    // },
                    // minorSplitLine: {
                    //     show: true
                    // },
                    boundaryGap: [0.05, 0.05],
                    axisLabel: {
                        show: true,
                        textStyle: {
                            color: 'white', //更改坐标轴文字颜色
                            fontSize: 20, //更改坐标轴文字大小
                        },
                        // interval: 'auto',
                        // formatter: '{value} %',
                    },
                },
                    ],
                series: [
                    {
                        name: '已完成',
                        data: [
                           100,
                            20,
                            38,
                            90,
                        ],
                        markLine: {
                            data: [{
    
                                yAxis:100
                            }],
                        },
                        type: 'bar',
                        barWidth: '40%',
                        showBackground: true,
                        itemStyle: {
                            normal: {
                                color: function(params) {
                                    const colorList = [
                                        ['#ED6191', '#F48B70'],
                                        ['#E9AC50', '#F1ED55'],
                                        ['#1F5FCE', '#6BB5FF'],
                                        ['#12A989', '#89FCC5'],
                                    ];
    
                                    var index = params.dataIndex;
                                    if (params.dataIndex >= colorList.length) {
                                        index = params.dataIndex - colorList.length;
                                    }
    
                                    return new echarts.graphic.LinearGradient(
                                        0,
                                        0,
                                        0,
                                        1,
                                        [
                                            {
                                                offset: 0,
                                                color: colorList[index][0],
                                            },
                                            {
                                                offset: 1,
                                                color: colorList[index][1]
                                            },
                                        ],
                                    );
                                },
                            },
                        },
                    },
                    {
                        name: '目标',
                        data: [
                             100,
                            20,
                            38,
                            90,
                        ],
                        type: 'bar'
                    },
    
                ],
            };
    

    图片说明

    评论

报告相同问题?

悬赏问题

  • ¥15 VESTA绘图原子颜色显示异常
  • ¥15 天翼云搭建多ip l2tp
  • ¥30 matlab求解刃位错方程
  • ¥15 python实现CAD识图
  • ¥15 如何实现在renpy中创建并应用不同大小尺寸对话框?
  • ¥15 table表格有一列是固定列 滑动到最下面时 固定的那一列有几行没显示出来
  • ¥20 单细胞数据注释时报错
  • ¥15 vscode编译ros找不到头文件,cmake.list文件出问题,如何解决?(语言-c++|操作系统-linux)
  • ¥15 通过AT指令控制esp8266发送信息
  • ¥15 有哪些AI工具提供可以通过代码上传EXCEL文件的API接口,并反馈分析结果