
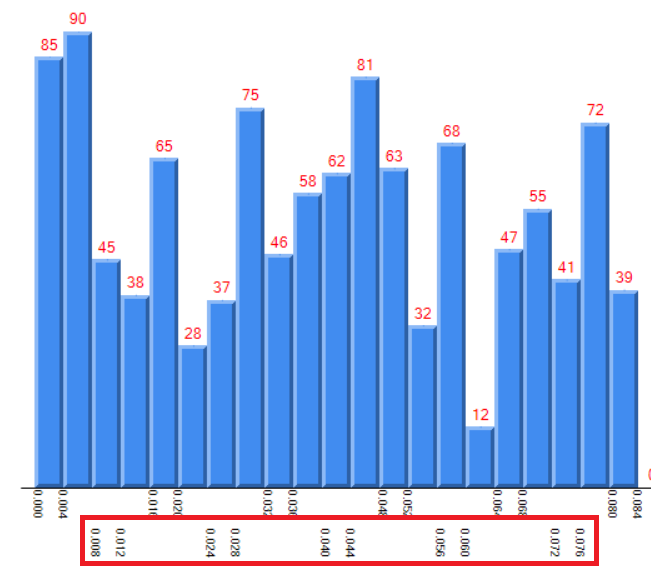
目的:柱状图用来统计某个区间的数量,在X轴用AxisLabel显示区间的上限和下限
问题:因为设置IsStaggered = True,所以AxisLabel的显示效果是分两层的,如何设置属性才能放到一样水平? 希望大家帮忙指教,万分感谢!! 本人QQ:865207156
代码:
Chart1.ChartAreas(0).AxisX.LabelStyle.IsStaggered = True
Chart1.ChartAreas(0).AxisX.LabelStyle.Angle = 90
    Chart1.Series(0).Points.Item(0).AxisLabel = "0.004\n\n0.000"
    Chart1.Series(0).Points.Item(0).YValues(0) = 85

    Chart1.Series(0).Points.Item(1).AxisLabel = " "
    Chart1.Series(0).Points.Item(1).YValues(0) = 90

    Chart1.Series(0).Points.Item(2).AxisLabel = "0.012\n\n0.008"
    Chart1.Series(0).Points.Item(2).YValues(0) = 45

    Chart1.Series(0).Points.Item(3).AxisLabel = " "
    Chart1.Series(0).Points.Item(3).YValues(0) = 38

    Chart1.Series(0).Points.Item(4).AxisLabel = "0.020\n\n0.016"
    Chart1.Series(0).Points.Item(4).YValues(0) = 65

    Chart1.Series(0).Points.Item(5).AxisLabel = " "
    Chart1.Series(0).Points.Item(5).YValues(0) = 28

    Chart1.Series(0).Points.Item(6).AxisLabel = "0.028\n\n0.024"
    Chart1.Series(0).Points.Item(6).YValues(0) = 37

    Chart1.Series(0).Points.Item(7).AxisLabel = " "
    Chart1.Series(0).Points.Item(7).YValues(0) = 75

    Chart1.Series(0).Points.Item(8).AxisLabel = "0.036\n\n0.032"
    Chart1.Series(0).Points.Item(8).YValues(0) = 46

    Chart1.Series(0).Points.Item(9).AxisLabel = " "
    Chart1.Series(0).Points.Item(9).YValues(0) = 58

    Chart1.Series(0).Points.Item(10).AxisLabel = "0.044\n\n0.040"
    Chart1.Series(0).Points.Item(10).YValues(0) = 62

    Chart1.Series(0).Points.Item(11).AxisLabel = " "
    Chart1.Series(0).Points.Item(11).YValues(0) = 81

    Chart1.Series(0).Points.Item(12).AxisLabel = "0.052\n\n0.048"
    Chart1.Series(0).Points.Item(12).YValues(0) = 63

    Chart1.Series(0).Points.Item(13).AxisLabel = " "
    Chart1.Series(0).Points.Item(13).YValues(0) = 32

    Chart1.Series(0).Points.Item(14).AxisLabel = "0.060\n\n0.056"
    Chart1.Series(0).Points.Item(14).YValues(0) = 68

    Chart1.Series(0).Points.Item(15).AxisLabel = " "
    Chart1.Series(0).Points.Item(15).YValues(0) = 12

    Chart1.Series(0).Points.Item(16).AxisLabel = "0.068\n\n0.064"
    Chart1.Series(0).Points.Item(16).YValues(0) = 47

    Chart1.Series(0).Points.Item(17).AxisLabel = " "
    Chart1.Series(0).Points.Item(17).YValues(0) = 55

    Chart1.Series(0).Points.Item(18).AxisLabel = "0.076\n\n0.072"
    Chart1.Series(0).Points.Item(18).YValues(0) = 41

    Chart1.Series(0).Points.Item(19).AxisLabel = " "
    Chart1.Series(0).Points.Item(19).YValues(0) = 72

    Chart1.Series(0).Points.Item(20).AxisLabel = "0.084\n\n0.080"
    Chart1.Series(0).Points.Item(20).YValues(0) = 39


