你快早点睡吧 2019-04-16 20:17 采纳率: 0%
浏览 783

echarts箭头错位,并未设置箭头格式

图片说明

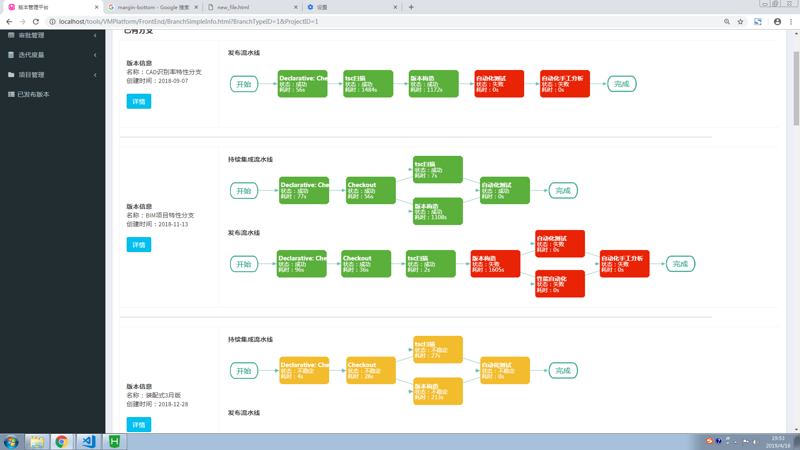
使用echarts箭头错位,并未设置箭头

function printPipelineChart(oPipeline, sBranchName, sChartID) {
    var sPipelineName = oPipeline["Name"];
    var sPipelineUrl = oPipeline["Url"];
    var forceOption = {
        title: {
            text: sPipelineName,
            padding: 5,
            textStyle: {
                fontSize: 14,
                lineHeight: 10
            }
        },
        tooltip: {
            show: false //提示框信息
        },
        animationDurationUpdate: 1500,//动画时长
        animationEasingUpdate: 'quinticInOut',
        textStyle: {
            color: '#fefefe'
        },
        series: [{
            type: 'graph',
            layout: 'none',
            roam: false,//鼠标缩放
            label: {
                normal: {
                    show: true,
                    textStyle: {
                        fontSize: '12'
                    },
                    formatter: [
                        '{name|{b}}',//样式为name
                        '{c}'
                    ].join('\n'),
                    rich: {
                        name: {
                            fontWeight: 'bold',
                            color: '#fefefe',
                            fontSize: '13'
                        }
                    },
                    textStyle: {
                        align: 'left'
                    },
                    offset: [-45, 0]//控制文本在框中的位置,【x,y】
                }
            },
            left: 19,
            itemStyle: {
                normal: {
                    label: {
                        show: true,
                        formatter: function (params) { //格式化提示文本
                            return params.name;//设置后面节点的样式
                        }
                    }
                }
            },
            edgeSymbol: ['none', 'none'],//无作用
            edgeSymbolSize: [1, 1],
            data: [],
            links: [],
            lineStyle: {//关系边的线条样式
                normal: {
                    opacity: 0.9,//透明度
                    width: 1,//线宽
                    color: '#72C0B0',

                    hoverAnimation: false

                }
            }
        }]
    };

    var sNodedata = []; //存放节点信息的数组
    var sNodeRelationship = []; //存放节点关系的数组
    var nXPointList = []; //存放节点X坐标
    var nYPointList = []; //存放节点Y坐标
    var nNodeWidthList = []; //存放节点宽度的数组
    var nPreNodeColumn = 0; //上一节点列数
    var nRowMax = 0; //最大行数,初始值为零
    var nCurrentRow = 0; //当前节点所在行
    var nRowCounts = []; //存放每一级层数
    var nNodeRows = []; //存放当前节点所在级的层数
    var Yspacing = 100; //纵向间距
    var Xspacing = 160; //横向间距
    var ChartHeight = 10 + (nRowMax - 1) * Yspacing; //画板高度
    var sLastName;
    var sNodes = oPipeline["Stages"]; //传回来是个数组
    sStatusMap = {
        "SUCCESS": "成功",
        "FAILURE": "失败",
        "FAILED": "失败",
        "UNSTABLE": "不稳定",
        "IN_PROCESS": "运行中",
        "NOT_BUILD": "未运行"
    };
    //计算每一列有几行(oRowCounts[nRow]), 计算每个节点在第几行(oNodeRows[nNode]),最多几行nRowMax
    for (var i = 0; i < sNodes.length; i++) {
        var oNode = sNodes[i];
        sLastID = oNode.ID;
        //新增

        if (oNode.StageColumn == nPreNodeColumn)//nPreNodeColumn初始值为零
        {
            nCurrentRow++;
        } else {
            nCurrentRow = 1;//上一列不为零,则当前节点数为1
        }
        if (nCurrentRow > nRowMax) {
            nRowMax = nCurrentRow;//增加一行
        }
        nPreNodeColumn = oNode.StageColumn;
        nRowCounts[oNode.StageColumn] = nCurrentRow; //每一级层数
        nNodeRows[i] = nCurrentRow; //当前节点所在级的层数
    }

    for (var i = 0; i < sNodes.length; i++) {
        var oNode = sNodes[i];
        sLastName = oNode.Name;
        var sName = oNode.Name;//名字
        var sStatus = oNode.Status;//状态均是英文
        var sCost = oNode.Cost;//耗时
        var sColumn = oNode.StageColumn;
        var sParentID = oNode.Parent;//父类id
        var sBackgroundColor = ""; //节点背景
        var sNodeWidth = 120; //节点宽度
        var sNodeHeight = 60; //节点高度
        var sValueInfo = [];
        var sSymbolSizeInfo;
        var sLableShow;
        var Xoffset = 0;
        var sAnimationInfo = true;
        var nXPoint = 13 + Xspacing * (sColumn);//x坐标等于13加上横向间距乘数目。
        var nYPoint = (10 + ChartHeight) / 2 + Yspacing * nNodeRows[i] - Yspacing / 2 * (nRowCounts[sColumn] + 1);

        //根据情况给节点添加节点信息
        if (sName == '开始' || sName == '运行中') {
            sNodeWidth = 62;
            sNodeHeight = 37;
            sValueInfo = [sName];//设置
            sSymbolSizeInfo = [sNodeWidth, sNodeHeight];
            sLableShow = false;
            Xoffset = sNodeWidth / 3;
        }
        else if (sName == '完成') {
            sNodeWidth = 75;
            sNodeHeight = 37;
            sValueInfo = [sName];
            sSymbolSizeInfo = [sNodeWidth, sNodeHeight];
            sLableShow = false;
            Xoffset = -sNodeWidth / 4;
            sAnimationInfo = false;
        } else if (sName == 'Filling') {
            sSymbolSizeInfo = 0;
        }
        else {
            if (sStatus == null) {
                sStatus = "未进行";
                sCost = 0;
            }
            var sNstatus = sStatus;

            if (sStatusMap[sStatus] == undefined) {
                sNstatus = sStatus;
            }
            else {
                sNstatus = sStatusMap[sStatus];
            }

            sValueInfo = ['状态:' + sNstatus + '\n耗时:' + sCost + 's'];//在此处修改状态信息;
            sSymbolSizeInfo = [sNodeWidth, sNodeHeight];
            sLableShow = true;
        }

        nXPointList[sName] = nXPoint;//
        nYPointList[sName] = nYPoint;
        nNodeWidthList[sName] = sNodeWidth;//对应节点名称的name获取长度;
        //根据情况给节点添加背景色,圆角矩形弧度为20像素
        if (sName == '开始') {
            sBackgroundColor = 'image://img/index/start.png';
        }
        else if (sName == '运行中') {
            sBackgroundColor = 'image://img/index/process.png';
        }
        else if (sName == '完成') {
            sBackgroundColor = 'image://img/index/end.png';
        }
        else {
            if (sStatus == 'SUCCESS')//根据状态显示图片
            {
                sBackgroundColor = 'image://img/index/green.png';
            }
            else if (sStatus == 'IN_PROCESS') {
                sBackgroundColor = 'image://img/index/blue.png';
            }
            else if (sStatus == 'UNSTABLE' || sStatus != undefined && sStatus.indexOf("警告") >= 0) {
                sBackgroundColor = 'image://img/index/yellow.png';
            }
            else {
                sBackgroundColor = 'image://img/index/pink.png';
            }
        }

        //显示信息
        sNodedata.push({
            name: sName,
            x: nXPoint,
            y: nYPoint,
            value: sValueInfo,
            textStyle: {
                align: 'left'
            },
            symbolSize: sSymbolSizeInfo,//大小
            symbol: sBackgroundColor,//颜色切换
            label: {
                normal: {
                    show: sLableShow//true
                }
            },
            hoverAnimation: sAnimationInfo,
            symbolOffset: [Xoffset, 0]
        });

        //将转折节点和节点关系存入数组
        if (sParentID != null) {//父节点不为空
            for (var j = 0; j < sParentID.length; j++) {//遍历有几个
                var nParentID = sParentID[j];//
                var nParentCount = sParentID.length; //父节点个数
                var nColumnNodes = nRowCounts[oNode.Column]; //获取当前列节点数
                if (nParentCount > 1 && nColumnNodes > 1) //2对2,父节点数大于1 ,并且当前行节点数大于2
                {
                    sNodedata.push({//压入数据
                        name: nParentID + "-" + sName + "4",
                        x: nXPoint - nNodeWidthList[sName] / 2 - (Xspacing - nNodeWidthList[nParentID] / 2 - nNodeWidthList[sName] / 2) / 3 * 2,
                        y: nYPointList[nParentID],
                        value: [''],
                        symbolSize: [1, 1],
                        itemStyle: {
                            normal: {
                                color: '#9C9c9c'
                            }
                        },
                        label: {
                            normal: {
                                show: false
                            }
                        }
                    }, {    //四个数据
                            name: nParentID + "-" + sName + "3",
                            x: nXPoint - nNodeWidthList[sName] / 2 - (Xspacing - nNodeWidthList[nParentID] / 2 - nNodeWidthList[sName] / 2) / 3 * 2,
                            y: (10 + ChartHeight) / 2,
                            value: [''],
                            symbolSize: [1, 1],
                            itemStyle: {
                                normal: {
                                    color: '#9C9c9c'
                                }
                            },
                            label: {
                                normal: {
                                    show: false
                                }
                            }
                        }, {
                            name: nParentID + "-" + sName + "1",
                            x: nXPoint - nNodeWidthList[sName] / 2 - (Xspacing - nNodeWidthList[nParentID] / 2 - nNodeWidthList[sName] / 2) / 3,
                            y: nYPoint,
                            value: [''],
                            symbolSize: [1, 1],
                            itemStyle: {
                                normal: {
                                    color: '#9C9c9c'
                                }
                            },
                            label: {
                                normal: {
                                    show: false
                                }
                            }
                        }, {
                            name: nParentID + "-" + sName + "2",
                            x: nXPoint - nNodeWidthList[sName] / 2 - (Xspacing - nNodeWidthList[nParentID] / 2 - nNodeWidthList[sName] / 2) / 3,
                            y: (10 + ChartHeight) / 2,
                            value: [''],
                            symbolSize: [1, 1],
                            itemStyle: {
                                normal: {
                                    color: '#9C9c9c'
                                }
                            },
                            label: {
                                normal: {
                                    show: false
                                }
                            }
                        });
                    sNodeRelationship.push({
                        source: nParentID + "-" + sName + "1",//源节点
                        target: sName//目标节点
                    }, {
                        source: nParentID + "-" + sName + "2",
                        target: nParentID + "-" + sName + "1"
                    }, {
                        source: nParentID + "-" + sName + "3",
                        target: nParentID + "-" + sName + "2"
                    }, {
                        source: nParentID + "-" + sName + "4",
                        target: nParentID + "-" + sName + "3"
                    }, {
                        source: nParentID,
                        target: nParentID + "-" + sName + "4"
                    });
                }
                else if (nParentCount == 1 && nColumnNodes > 1) //1对2
                {
                    sNodedata.push({
                        name: nParentID + "-" + sName + "1",
                        x: (nXPoint + nXPointList[nParentID]) / 2,
                        y: nYPoint,
                        value: [''],
                        symbolSize: [1, 1],
                        itemStyle: {
                            normal: {
                                color: '#9C9c9c'
                            }
                        },
                        label: {
                            normal: {
                                show: false
                            }
                        }
                    }, {
                            name: nParentID + "-" + sName + "2",
                            x: (nXPoint + nXPointList[nParentID]) / 2,
                            y: nYPointList[nParentID],
                            value: [''],
                            symbolSize: [1, 1],
                            itemStyle: {
                                normal: {
                                    color: '#9C9c9c'
                                }
                            },
                            label: {
                                normal: {
                                    show: false
                                }
                            }
                        });

                    sNodeRelationship.push({
                        source: nParentID + "-" + sName + "1",
                        target: sName
                    }, {
                            source: nParentID + "-" + sName + "2",
                            target: nParentID + "-" + sName + "1"
                        }, {
                            source: nParentID,
                            target: nParentID + "-" + sName + "2"
                        });
                }
                else if (nParentCount > 1 && nColumnNodes == 1) //2对1
                {
                    sNodedata.push({
                        name: nParentID + "-" + sName + "2",
                        x: (nXPoint + nXPointList[nParentID]) / 2,
                        y: nYPointList[nParentID],
                        value: [''],
                        symbolSize: [1, 1],
                        itemStyle: {
                            normal: {
                                color: '#9C9c9c'
                            }
                        },
                        label: {
                            normal: {
                                show: false
                            }
                        }
                    }, {
                            name: nParentID + "-" + sName + "1",
                            x: (nXPoint + nXPointList[nParentID]) / 2,
                            y: nYPoint,
                            value: [''],
                            symbolSize: [1, 1],
                            itemStyle: {
                                normal: {
                                    color: '#9C9c9c'
                                }
                            },
                            label: {
                                normal: {
                                    show: false
                                }
                            }
                        });
                    sNodeRelationship.push({
                        source: nParentID + "-" + sName + "1",
                        target: sName
                    }, {
                            source: nParentID + "-" + sName + "2",
                            target: nParentID + "-" + sName + "1"
                        }, {
                            source: nParentID,
                            target: nParentID + "-" + sName + "2"
                        });

                }
                else {
                    sNodeRelationship.push({//一对一
                        source: nParentID,
                        target: sName
                    });
                }
            }
        }
    }

    forceOption.series[0].data = sNodedata;
    forceOption.series[0].links = sNodeRelationship;

    var nChartWidth = nXPointList[sLastName] + Xspacing - 60;
    $("#" + sChartID).height('160px');//高度宽度
    $("#" + sChartID).width(nChartWidth + 'px');


    var forceChart = echarts.getInstanceByDom(document.getElementById(sChartID));//定义表格schartID就是forceChart加上分支di加上流水线id
    if (forceChart == null) {

        forceChart = echarts.init(document.getElementById(sChartID));
    }
    var forceChart = echarts.init(document.getElementById(sChartID));

    forceChart.setOption(forceOption);

    //为节点添加点击事件
    forceChart.on('click', function (params) {
        var name = params.name;
        if (params.dataType == "node") {
            if (name == '开始') {
                onBuildClick(sPipelineUrl, sBranchName, sPipelineName);
            } else if (name == '完成') {
                event.preventDefault();
            } else {
                window.open(sPipelineUrl + "/lastBuild");
            }
        }
    });
}

以上是绘制表格所有代码。感谢各位大佬提携。

  • 写回答

1条回答 默认 最新

  • 一只小爪磕 前端领域新星创作者 2024-06-26 22:35
    关注

    您好题主!
    本答案参考GPT-4o,由爪磕整理并总结,希望对您有所帮助!


    要解决 ECharts 箭头错位的问题,可以从以下几个方面进行优化和调整:

    1. 检查箭头符号:确保箭头符号的设置是正确的。
    2. 调整位置和大小:调整节点的位置和大小,确保箭头符号正确对齐。
    3. **更新 edgeSymboledgeSymbolSize**:检查和更新 edgeSymboledgeSymbolSize 的配置。

    修改后的代码

    在你的代码基础上,以下是修改后的部分:

    printPipelineChart 函数

    function printPipelineChart(oPipeline, sBranchName, sChartID) {
        var sPipelineName = oPipeline["Name"];
        var sPipelineUrl = oPipeline["Url"];
        var forceOption = {
            title: {
                text: sPipelineName,
                padding: 5,
                textStyle: {
                    fontSize: 14,
                    lineHeight: 10
                }
            },
            tooltip: {
                show: false //提示框信息
            },
            animationDurationUpdate: 1500,//动画时长
            animationEasingUpdate: 'quinticInOut',
            textStyle: {
                color: '#fefefe'
            },
            series: [{
                type: 'graph',
                layout: 'none',
                roam: false,//鼠标缩放
                label: {
                    normal: {
                        show: true,
                        textStyle: {
                            fontSize: '12'
                        },
                        formatter: [
                            '{name|{b}}',//样式为name
                            '{c}'
                        ].join('\n'),
                        rich: {
                            name: {
                                fontWeight: 'bold',
                                color: '#fefefe',
                                fontSize: '13'
                            }
                        },
                        textStyle: {
                            align: 'left'
                        },
                        offset: [-45, 0]//控制文本在框中的位置,【x,y】
                    }
                },
                left: 19,
                itemStyle: {
                    normal: {
                        label: {
                            show: true,
                            formatter: function (params) { //格式化提示文本
                                return params.name;//设置后面节点的样式
                            }
                        }
                    }
                },
                edgeSymbol: ['circle', 'arrow'], // 修改为 'circle''arrow'
                edgeSymbolSize: [4, 10], // 调整箭头大小
                data: [],
                links: [],
                lineStyle: {//关系边的线条样式
                    normal: {
                        opacity: 0.9,//透明度
                        width: 1,//线宽
                        color: '#72C0B0',
                        hoverAnimation: false
                    }
                }
            }]
        };
    
        var sNodedata = []; //存放节点信息的数组
        var sNodeRelationship = []; //存放节点关系的数组
        var nXPointList = []; //存放节点X坐标
        var nYPointList = []; //存放节点Y坐标
        var nNodeWidthList = []; //存放节点宽度的数组
        var nPreNodeColumn = 0; //上一节点列数
        var nRowMax = 0; //最大行数,初始值为零
        var nCurrentRow = 0; //当前节点所在行
        var nRowCounts = []; //存放每一级层数
        var nNodeRows = []; //存放当前节点所在级的层数
        var Yspacing = 100; //纵向间距
        var Xspacing = 160; //横向间距
        var ChartHeight = 10 + (nRowMax - 1) * Yspacing; //画板高度
        var sLastName;
        var sNodes = oPipeline["Stages"]; //传回来是个数组
        sStatusMap = {
            "SUCCESS": "成功",
            "FAILURE": "失败",
            "FAILED": "失败",
            "UNSTABLE": "不稳定",
            "IN_PROCESS": "运行中",
            "NOT_BUILD": "未运行"
        };
        //计算每一列有几行(oRowCounts[nRow]), 计算每个节点在第几行(oNodeRows[nNode]),最多几行nRowMax
        for (var i = 0; i < sNodes.length; i++) {
            var oNode = sNodes[i];
            sLastID = oNode.ID;
            //新增
     
            if (oNode.StageColumn == nPreNodeColumn)//nPreNodeColumn初始值为零
            {
                nCurrentRow++;
            } else {
                nCurrentRow = 1;//上一列不为零,则当前节点数为1
            }
            if (nCurrentRow > nRowMax) {
                nRowMax = nCurrentRow;//增加一行
            }
            nPreNodeColumn = oNode.StageColumn;
            nRowCounts[oNode.StageColumn] = nCurrentRow; //每一级层数
            nNodeRows[i] = nCurrentRow; //当前节点所在级的层数
        }
     
        for (var i = 0; i < sNodes.length; i++) {
            var oNode = sNodes[i];
            sLastName = oNode.Name;
            var sName = oNode.Name;//名字
            var sStatus = oNode.Status;//状态均是英文
            var sCost = oNode.Cost;//耗时
            var sColumn = oNode.StageColumn;
            var sParentID = oNode.Parent;//父类id
            var sBackgroundColor = ""; //节点背景
            var sNodeWidth = 120; //节点宽度
            var sNodeHeight = 60; //节点高度
            var sValueInfo = [];
            var sSymbolSizeInfo;
            var sLableShow;
            var Xoffset = 0;
            var sAnimationInfo = true;
            var nXPoint = 13 + Xspacing * (sColumn);//x坐标等于13加上横向间距乘数目。
            var nYPoint = (10 + ChartHeight) / 2 + Yspacing * nNodeRows[i] - Yspacing / 2 * (nRowCounts[sColumn] + 1);
     
            //根据情况给节点添加节点信息
            if (sName == '开始' || sName == '运行中') {
                sNodeWidth = 62;
                sNodeHeight = 37;
                sValueInfo = [sName];//设置
                sSymbolSizeInfo = [sNodeWidth, sNodeHeight];
                sLableShow = false;
                Xoffset = sNodeWidth / 3;
            }
            else if (sName == '完成') {
                sNodeWidth = 75;
                sNodeHeight = 37;
                sValueInfo = [sName];
                sSymbolSizeInfo = [sNodeWidth, sNodeHeight];
                sLableShow = false;
                Xoffset = -sNodeWidth / 4;
                sAnimationInfo = false;
            } else if (sName == 'Filling') {
                sSymbolSizeInfo = 0;
            }
            else {
                if (sStatus == null) {
                    sStatus = "未进行";
                    sCost = 0;
                }
                var sNstatus = sStatus;
     
                if (sStatusMap[sStatus] == undefined) {
                    sNstatus = sStatus;
                }
                else {
                    sNstatus = sStatusMap[sStatus];
                }
     
                sValueInfo = ['状态:' + sNstatus + '\n耗时:' + sCost + 's'];//在此处修改状态信息;
                sSymbolSizeInfo = [sNodeWidth, sNodeHeight];
                sLableShow = true;
            }
     
            nXPointList[sName] = nXPoint;//
            nYPointList[sName] = nYPoint;
            nNodeWidthList[sName] = sNodeWidth;//对应节点名称的name获取长度;
            //根据情况给节点添加背景色,圆角矩形弧度为20像素
            if (sName == '开始') {
                sBackgroundColor = 'image://img/index/start.png';
            }
            else if (sName == '运行中') {
                sBackgroundColor = 'image://img/index/process.png';
            }
            else if (sName == '完成') {
                sBackgroundColor = 'image://img/index/end.png';
            }
            else {
                if (sStatus == 'SUCCESS')//根据状态显示图片
                {
                    sBackgroundColor = 'image://img/index/green.png';
                }
                else if (sStatus == 'IN_PROCESS') {
                    sBackgroundColor = 'image://img/index/blue.png';
                }
                else if (sStatus == 'UNSTABLE' || sStatus != undefined && sStatus.indexOf("警告") >= 0) {
                    sBackgroundColor = 'image://img/index/yellow.png';
                }
                else {
                    sBackgroundColor = 'image://img/index/pink.png';
                }
            }
     
            //显示信息
            sNodedata.push({
                name: sName,
                x: nXPoint,
                y: nYPoint,
                value: sValueInfo,
                textStyle: {
                    align: 'left'
                },
                symbolSize: sSymbolSizeInfo,//大小
                symbol: sBackgroundColor,//颜色切换
                label: {
                    normal: {
                        show: sLableShow//true
                    }
                },
                hoverAnimation: sAnimationInfo,
                symbolOffset: [Xoffset, 0]
            });
     
            //将转折节点和节点关系存入数组
            if (sParentID != null) {//父节点不为空
                for (var j = 0; j < sParentID.length; j++) {//遍历有几个
                    var nParentID = sParentID[j];//
                    var nParentCount = sParentID.length; //父节点个数
                    var nColumnNodes = nRowCounts[oNode.Column]; //获取当前列节点数
                    if (nParentCount > 1 && nColumnNodes > 1) //22,父节点数大于1 ,并且当前行节点数大于2
                    {
                        sNodedata.push({//压入数据
                            name: nParentID + "-" + sName + "4",
                            x: nXPoint - nNodeWidthList[sName] / 2 - (Xspacing - nNodeWidthList[nParentID] / 2 - nNodeWidthList[sName] / 2) / 3 * 2,
                            y: nYPointList[nParentID],
                            value: [''],
                            symbolSize: [1, 1],
                            itemStyle: {
                                normal: {
                                    color: '#9C9c9c'
                                }
                            },
                            label: {
                                normal: {
                                    show: false
                                }
                            }
                        }, {    //四个数据
                                name: nParentID + "-" + sName + "3",
                                x: nXPoint - nNodeWidthList[sName] / 2 - (Xspacing - nNodeWidthList[nParentID] / 2 - nNodeWidthList[sName] / 2) / 3 * 2,
                                y: (10 + ChartHeight) / 2,
                                value: [''],
                                symbolSize: [1, 1],
                                itemStyle: {
                                    normal: {
                                        color: '#9C9c9c'
                                    }
                                },
                                label: {
                                    normal: {
                                        show: false
                                    }
                                }
                            }, {
                                name: nParentID + "-" + sName + "1",
                                x: nXPoint - nNodeWidthList[sName] / 2 - (Xspacing - nNodeWidthList[nParentID] / 2 - nNodeWidthList[sName] / 2) / 3,
                                y: nYPoint,
                                value: [''],
                                symbolSize: [1, 1],
                                itemStyle: {
                                    normal: {
                                        color: '#9C9c9c'
                                    }
                                },
                                label: {
                                    normal: {
                                        show: false
                                    }
                                }
                            }, {
                                name: nParentID + "-" + sName + "2",
                                x: nXPoint - nNodeWidthList[sName] / 2 - (Xspacing - nNodeWidthList[nParentID] / 2 - nNodeWidthList[sName] / 2) / 3,
                                y: (10 + ChartHeight) / 2,
                                value: [''],
                                symbolSize: [1, 1],
                                itemStyle: {
                                    normal: {
                                        color: '#9C9c9c'
                                    }
                                },
                                label: {
                                    normal: {
                                        show: false
                                    }
                                }
                            });
                        sNodeRelationship.push({
                            source: nParentID + "-" + sName + "1",//源节点
                            target: sName//目标节点
                        }, {
                            source: nParentID + "-" + sName + "2",
                            target: nParentID + "-" + sName + "1"
                        }, {
                            source: nParentID + "-" + sName + "3",
                            target: nParentID + "-" + sName + "2"
                        }, {
                            source: nParentID + "-" + sName + "4",
                            target: nParentID + "-" + sName + "3"
                        }, {
                            source: nParentID,
                            target: nParentID + "-" + sName + "4"
                        });
                    }
                    else if (nParentCount == 1 && nColumnNodes > 1) //12
                    {
                        sNodedata.push({
                            name: nParentID + "-" + sName + "1",
                            x: (nXPoint + nXPointList[nParentID]) / 2,
                            y: nYPoint,
                            value: [''],
                            symbolSize: [1, 1],
                            itemStyle: {
                                normal: {
                                    color: '#9C9c9c'
                                }
                            },
                            label: {
                                normal: {
                                    show: false
                                }
                            }
                        }, {
                                name: nParentID + "-" + sName + "2",
                                x: (nXPoint + nXPointList[nParentID]) / 2,
                                y: nYPointList[nParentID],
                                value: [''],
                                symbolSize: [1, 1],
                                itemStyle: {
                                    normal: {
                                        color: '#9C9c9c'
                                    }
                                },
                                label: {
                                    normal: {
                                        show: false
                                    }
                                }
                            });
     
                        sNodeRelationship.push({
                            source: nParentID + "-" + sName + "1",
                            target: sName
                        }, {
                                source: nParentID + "-" + sName + "2",
                                target: nParentID + "-" + sName + "1"
                            }, {
                                source: nParentID,
                                target: nParentID + "-" + sName + "2"
                            });
                    }
                    else if (nParentCount > 1 && nColumnNodes == 1) //21
                    {
                        sNodedata.push({
                            name: nParentID + "-" + sName + "2",
                            x: (nXPoint + nXPointList[nParentID]) / 2,
                            y: nYPointList[nParentID],
                            value: [''],
                            symbolSize: [1, 1],
                            itemStyle: {
                                normal: {
                                    color: '#9C9c9c'
                                }
                            },
                            label: {
                                normal: {
                                    show: false
                                }
                            }
                        }, {
                                name: nParentID + "-" + sName + "1",
                                x: (nXPoint + nXPointList[nParentID]) / 2,
                                y: nYPoint,
                                value: [''],
                                symbolSize: [1, 1],
                                itemStyle: {
                                    normal: {
                                        color: '#9C9c9c'
                                    }
                                },
                                label: {
                                    normal: {
                                        show: false
                                    }
                                }
                            });
                        sNodeRelationship.push({
                            source: nParentID + "-" + sName + "1",
                            target: sName
                        }, {
                                source: nParentID + "-" + sName + "2",
                                target: nParentID + "-" + sName + "1"
                            }, {
                                source: nParentID,
                                target: nParentID + "-" + sName + "2"
                            });
     
                    }
                    else {
                        sNodeRelationship.push({//一对一
                            source: nParentID,
                            target: sName
                        });
                    }
                }
            }
        }
     
        forceOption.series[0].data = sNodedata;
        forceOption.series[0].links = sNodeRelationship;
     
        var nChartWidth = nXPointList[sLastName] + Xspacing - 60;
        $("#" + sChartID).height('160px');//高度宽度
        $("#" + sChartID).width(nChartWidth + 'px');
     
     
        var forceChart = echarts.getInstanceByDom(document.getElementById(sChartID));//定义表格schartID就是forceChart加上分支di加上流水线id
        if (forceChart == null) {
     
            forceChart = echarts.init(document.getElementById(sChartID));
        }
        var forceChart = echarts.init(document.getElementById(sChartID));
     
        forceChart.setOption(forceOption);
     
        //为节点添加点击事件
        forceChart.on('click', function (params) {
            var name = params.name;
            if (params.dataType == "node") {
                if (name == '开始') {
                    onBuildClick(sPipelineUrl, sBranchName, sPipelineName);
                } else if (name == '完成') {
                    event.preventDefault();
                } else {
                    window.open(sPipelineUrl + "/lastBuild");
                }
            }
        });
    }
    

    解释

    1. edgeSymboledgeSymbolSize 设置:将 edgeSymbol 设置为 ['circle', 'arrow']edgeSymbolSize 设置为 [4, 10],来确保箭头正确显示和对齐。
    2. 节点位置调整:确保节点的 xy 坐标正确计算和对齐。

    通过这些调整,可以确保箭头符号正确显示和对齐。如果问题仍然存在,可以进一步调整 edgeSymbolSize 的大小,确保箭头符号在图表中正确显示。

    评论

报告相同问题?

悬赏问题

  • ¥15 Opencv(C++)异常
  • ¥15 VScode上配置C语言环境
  • ¥15 汇编语言没有主程序吗?
  • ¥15 这个函数为什么会爆内存
  • ¥15 无法装系统,grub成了顽固拦路虎
  • ¥15 springboot aop 应用启动异常
  • ¥15 matlab有关债券凸性久期的代码
  • ¥15 lvgl v8.2定时器提前到来
  • ¥15 qtcp 发送数据时偶尔会遇到发送数据失败?用的MSVC编译器(标签-qt|关键词-tcp)
  • ¥15 cam_lidar_calibration报错