
<!DOCTYPE html>
<html style="height: 100%">
   <head>
       <meta charset="utf-8">
       <script src="http://echarts.baidu.com/dist/echarts.min.js"></script>
<script src="http://libs.baidu.com/jquery/2.0.0/jquery.min.js"></script>
</head>
<body style="height: 100%; margin: 0">
<div id="container" style="height: 100%"></div>
</body>
</html>
<script type="text/javascript">
var dom = document.getElementById("container");
var myChart = echarts.init(dom);
var app = {};
option = null;
var symbolSize = 20;
var data = [
[15, 0],
[-50, 10],
[-56.5, 20],
[-46.5, 30],
[-22.1, 40]
];
option = {
title: {
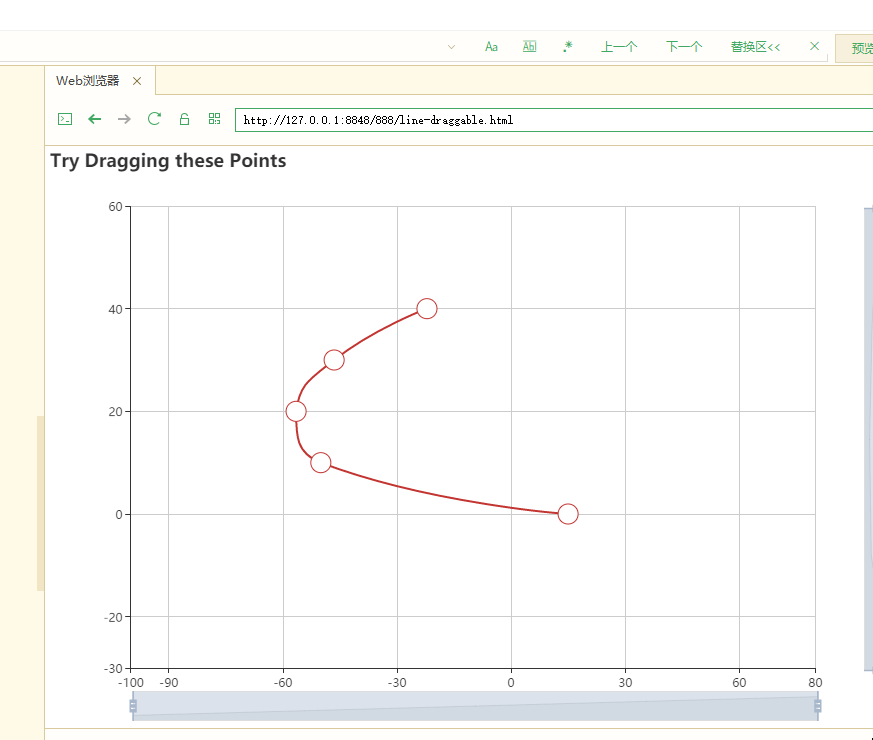
text: 'Try Dragging these Points'
},
tooltip: {
triggerOn: 'none',
formatter: function (params) {
return 'X: ' + params.data[0].toFixed(2) + '<br>Y: ' + params.data[1].toFixed(2);
}
},
grid: {
},
xAxis: {
min: -100,
max: 80,
type: 'value',
axisLine: {onZero: false},
data: ['Mon', 'Tue', 'Wed', 'Thu', 'Fri', 'Sat', 'Sun']
},
yAxis: {
min: -30,
max: 60,
type: 'value',
axisLine: {onZero: false},
},
dataZoom: [
{
type: 'slider',
xAxisIndex: 0,
filterMode: 'empty'
},
{
type: 'slider',
yAxisIndex: 0,
filterMode: 'empty'
},
{
type: 'inside',
xAxisIndex: 0,
filterMode: 'empty'
},
{
type: 'inside',
yAxisIndex: 0,
filterMode: 'empty'
}
],
series: [
{
id: 'a',
type: 'line',
smooth: true,
symbolSize: symbolSize,
data: data
}
]
};
if (!app.inNode) {
setTimeout(function () {
// Add shadow circles (which is not visible) to enable drag.
myChart.setOption({
graphic: echarts.util.map(data, function (item, dataIndex) {
return {
type: 'circle',
position: myChart.convertToPixel('grid', item),
shape: {
cx: 0,
cy: 0,
r: symbolSize / 2
},
invisible: true,
draggable: true,
ondrag: echarts.util.curry(onPointDragging, dataIndex),
onmousemove: echarts.util.curry(showTooltip, dataIndex),
onmouseout: echarts.util.curry(hideTooltip, dataIndex),
z: 100
};
})
});
}, 0);
window.addEventListener('resize', updatePosition);
}
myChart.on('dataZoom', updatePosition);
function updatePosition() {
myChart.setOption({
graphic: echarts.util.map(data, function (item, dataIndex) {
return {
position: myChart.convertToPixel('grid', item)
};
})
});
}
function showTooltip(dataIndex) {
myChart.dispatchAction({
type: 'showTip',
seriesIndex: 0,
dataIndex: dataIndex
});
}
function hideTooltip(dataIndex) {
myChart.dispatchAction({
type: 'hideTip'
});
}
function onPointDragging(dataIndex, dx, dy) {
data[dataIndex] = myChart.convertFromPixel('grid', this.position);
// Update data
myChart.setOption({
series: [{
id: 'a',
data: data
}]
});
}
;
if (option && typeof option === "object") {
myChart.setOption(option, true);
}
</script>
想做个拖拽的动态图表 ajxa传输json方式做出了正常的曲线 图 拖拽的 没想明白 希望大神能详细点讲下


