echarts 关系图拖动延迟
echarts graph图示拖动时节点没有跟随鼠标而是拖动结束后位置发生改变,看了一下文档每次拖动的好像是虚拟节点。虚拟节点是跟随鼠标的。所以想问一下各位 大 佬 这个有解决的办法嘛?下面代码放到官网示例拖动可看到效果。
期望效果https://echarts.apache.org/examples/zh/editor.html?c=line-draggable
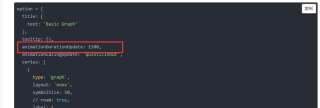
option = {
title: {
text: 'Basic Graph'
},
tooltip: {},
animationDurationUpdate: 1500,
animationEasingUpdate: 'quinticInOut',
series: [
{
type: 'graph',
layout: 'none',
symbolSize: 50,
// roam: true,
label: {
show: true
},
draggable: true,
edgeSymbol: ['circle', 'arrow'],
edgeSymbolSize: [4, 10],
edgeLabel: {
fontSize: 20
},
data: [
{ name: '1', x: 0, y: 0 },
{ name: '2', x: 0, y: 50 },
{ name: '3', x: 50, y: 50 },
{ name: '4', x: 50, y: 100 },
{ name: '5', x: 50, y: 150 },
{ name: '6', x: 50, y: 200 },
{ name: '7', x: 100, y: 50 },
{ name: '8', x: 150, y: 50 },
{ name: '9', x: 150, y: 100 },
{ name: '10', x: 200, y: 100 },
{ name: '11', x: 200, y: 50 },
{ name: '12', x: 200, y: 200 },
{ name: '13', x: 200, y: 250 },
{ name: '14', x: 250, y: 50 },
{ name: '15', x: 250, y: 100 },
{ name: '16', x: 300, y: 50 },
{ name: '17', x: 300, y: 150 },
{ name: '18', x: 300, y: 200 },
{ name: '19', x: 350, y: 50 },
{ name: '20', x: 350, y: 250 },
{ name: '21', x: 350, y: 300 },
{ name: '22', x: 400, y: 50 },
{ name: '23', x: 400, y: 100 },
{ name: '24', x: 450, y: 50 }
],
// links: [],
links: [
{ source: '2', target: '3' },
{ source: '2', target: '10' },
{ source: '3', target: '7' },
{ source: '3', target: '8' },
{ source: '3', target: '10' },
{ source: '3', target: '11' },
{ source: '8', target: '6' },
{ source: '8', target: '10' },
{ source: '8', target: '11' },
{ source: '9', target: '6' },
{ source: '9', target: '10' },
{ source: '9', target: '11' },
{ source: '10', target: '15' },
{ source: '10', target: '12' },
{ source: '11', target: '14' },
{ source: '16', target: '10' },
{ source: '16', target: '11' },
{ source: '15', target: '16' },
{ source: '15', target: '19' },
{ source: '15', target: '23' },
{ source: '15', target: '18' },
{ source: '14', target: '16' },
{ source: '14', target: '19' },
{ source: '14', target: '23' },
{ source: '14', target: '18' },
{ source: '19', target: '22' },
{ source: '22', target: '24' },
{ source: '4', target: '10' },
{ source: '5', target: '10' },
{ source: '12', target: '13' },
{ source: '13', target: '15' },
{ source: '13', target: '12' },
{ source: '7', target: '6' },
{ source: '7', target: '8' },
{ source: '7', target: '3' },
{ source: '7', target: '10' },
{ source: '23', target: '17' },
{ source: '23', target: '18' },
{ source: '17', target: '19' },
{ source: '6', target: '7' },
{ source: '6', target: '8' }
],
lineStyle: {
opacity: 0.9,
width: 2,
curveness: 0.2
},
itemStyle: {
normal: {
color: '#3333FF'
}
}
}
]
};
setTimeout(function () {
myChart.setOption({
graphic: echarts.util.map(
option.series[0].data,
function (item, dataIndex) {
//使用图形元素组件在节点上划出一个隐形的图形覆盖住节点
var tmpPos = myChart.convertToPixel({ seriesIndex: 0 }, [
item.x,
item.y
]);
return {
type: 'circle',
// id: item.id,
position: tmpPos,
shape: {
cx: 0,
cy: 0,
r: 20
},
// silent:true,
invisible: true,
draggable: true,
dataIndex,
ondrag: echarts.util.curry(onPointDragging, dataIndex),
z: 100 //使图层在最高层
};
}
)
});
}, 0);
// window.addEventListener('resize', updatePosition);
myChart.on('dataZoom', updatePosition);
myChart.on('graphRoam', updatePosition);
function updatePosition() {
//更新节点定位的函数
myChart.setOption({
graphic: echarts.util.map(
option.series[0].data,
function (item, dataIndex) {
var tmpPos = myChart.convertToPixel({ seriesIndex: 0 }, [
item.x,
item.y
]);
return {
position: tmpPos
};
}
)
});
}
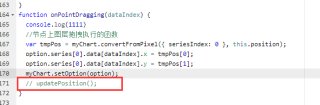
function onPointDragging(dataIndex) {
//节点上图层拖拽执行的函数
var tmpPos = myChart.convertFromPixel({ seriesIndex: 0 }, this.position);
option.series[0].data[dataIndex].x = tmpPos[0];
option.series[0].data[dataIndex].y = tmpPos[1];
myChart.setOption(option);
updatePosition();
}