

# noinspection PyUnresolvedReferences
import pandas as pd
# noinspection PyUnresolvedReferences
import numpy as np
# noinspection PyUnresolvedReferences
import seaborn as sns
# noinspection PyUnresolvedReferences
import matplotlib.pyplot as plt

df=pd.read_csv('E:/车辆轨迹数据-6月/071201-200/M8005170-20210601-20210630.csv')

col=df.columns.values
df.columns=[x.strip() for x in col]     ###首行文字去前后空格
df.drop_duplicates(subset=['gpstime'],keep='first',inplace=True)  ##删除gps时间重复的列
####数据预处理—————排序
df_paixu=df.sort_values(by=['gpstime'],ascending=[1])
df_paixu=df_paixu.reset_index(drop=True)  ###重置排序后数列的index
df_paixu['gpstime']=(df_paixu['gpstime']-min(df_paixu['gpstime']))/1000
t=df_paixu['gpstime']
#####数据预处理————数据单位转化为标准单位及百分比
df_paixu['speed']=(df_paixu['speed'])/100/3.6   #车速单位km/h

##速度修正
def v(vt):
    l=df_paixu['speed']
    for i in vt:
        if i<=3.6:
            l.append(0)
        elif i<=7.2:
            l.append(7.2-(7.2/(7.2-3.6))*(7.2-i))
        else:
            l.append(i)
    return l
'''if df_paixu['speed']<=3.6:
    eq1 = 0
elif 3.6<df_paixu['speed']<=7.2:
    eq2 = 7.2 - (7.2 / (7.2 - 3.6)) * (7.2 - df_paixu['speed'])
else:
    eq3 = df_paixu['speed']
df_paixu['speed'][eq1&eq2&eq3]'''

'''##读取1-500s时间段内的数据
open_time='0.00'
close_time='500.00'
con1=df_paixu['gpstime']>=open_time
con2=df_paixu['gpstime']<close_time
df[con1&con2]'''
##

##画图
x = df.loc[:,'gpstime']# 读取csv文件中的某两列
y = df.loc[:,'speed']
plt.plot(x,y,color='r', label=u'1路')  # 绘制x,y的折线图
plt.savefig(r'C:\Users\歪歪\Desktop\工况预估\1.jpg')#保存图片
plt.show()  # 显示折线图
###出现问题
最后的图还是未处理的数据图
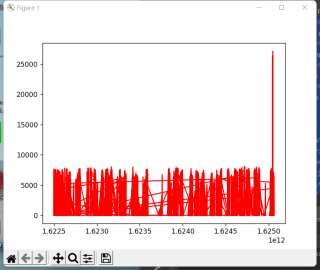
怎么将处理之后的数据重新画图


