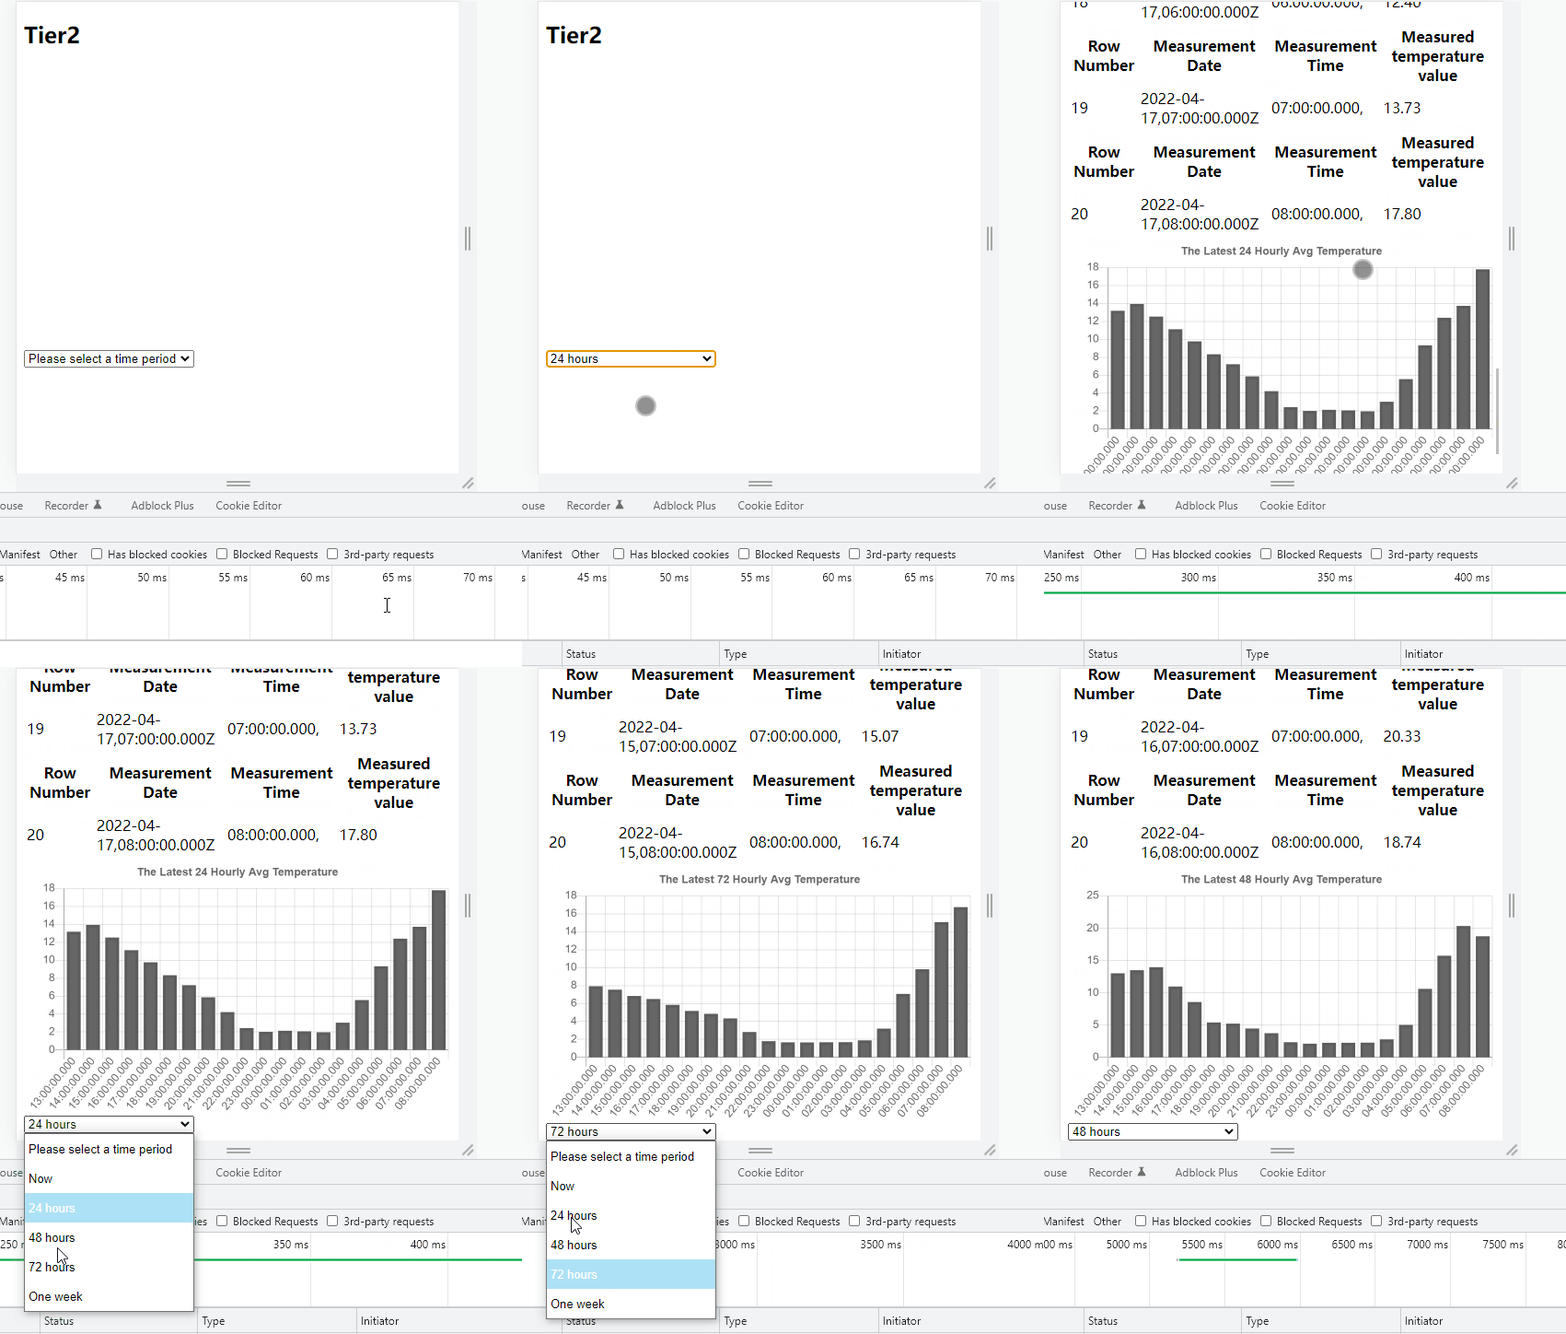
问题遇到的现象和发生背景
不知道怎么在button点击之后的页面里,出现下拉菜单并关联
问题相关代码,请勿粘贴截图
<!DOCTYPE html>
<html lang="en">
    <head>
      <title>Final Assigment</title>
        <script type="text/javascript"></script>
        <meta charset="UTF-8">
        <meta name="viewport" content="width=device-width, initial-scale=1.0">
          <script defer src="final.js"></script>
          <script src="https://cdnjs.cloudflare.com/ajax/libs/Chart.js/2.9.4/Chart.js"></script>
        <link rel="stylesheet" href="final.css">
    </head>

      <body onload="thirty_measurement()">
        <h2>Tier2 </h2>
        <button id="twenty_temp">Recent weather data</button>
        <div id="output"></div>
        <canvas id="weather_chart" width="500" height="300">
          <div id="DropDown"></div>

      </body>
      </html>
let chart1=null;
const setList=document.getElementById("DropDown");
document.getElementById('twenty_temp').addEventListener('click', twenty_temp);

function twenty_temp() {
    fetch("http://webapi19sa-1.course.tamk.cloud/v1/weather/temperature")
    .then((res) => res.json())
    .then((data) => {
        let output = '<h2>20 Temperature Data</h2>';
        let x_axis=new Array();
        let y_axis=new Array();
        for(let i = 0; i < 20; i++) {
            const weatherData = data[i];

            let seperate=JSON.stringify(weatherData.date_time);
            let arr = seperate.split("\"")[1];
//Here using split to devide array, as it has T at the end of date and time
            let sep_date = arr.split("T");
            let sep_time = sep_date[1].split("Z");
            x_axis[i]=sep_time[0];
            y_axis[i]=weatherData.temperature;
            output += `
    <table class="tableView2">
        <tr>
            <th>Row Number</th>
            <th>Measurement Date</th>
            <th>Measurement Time</th>
            <th>Measured temperature value</th>
        </tr>
        <tr>
            <td>${i + 1}</td>
            <td>${sep_date}</td>
            <td>${sep_time}</td>
            <td>${weatherData.temperature}</td>
        </tr>

        </table>
        `;
        }
        document.getElementById('output').innerHTML = output;
        chart_temp(x_axis,y_axis,data.length);
    })
}

function DropDown2(){
    setList.innerHTML=null;
    setList.innerHTML=`<select onchange="selectList2(this.value)">
    <option selected>Please select a time period</option>
    <option value="1">Now</option>
    <option value="2">24 hours</option>
    <option value="3">48 hours</option>
    <option value="4">72 hours</option>
    <option value="5">One week</option>
    </select>
    `
}

function selectList2(value){
    if(value==1){
        clickTage2("http://webapi19sa-1.course.tamk.cloud/v1/weather/temperature");
    }
    else if(value==2){
        clickTage2("http://webapi19sa-1.course.tamk.cloud/v1/weather/temperature/23");
    }
    else if(value==3){
        clickTage2("http://webapi19sa-1.course.tamk.cloud/v1/weather/temperature/47");
    }
    else if(value==4){
        clickTage2("http://webapi19sa-1.course.tamk.cloud/v1/weather/temperature/71");
    }
    else{
        clickTage2("http://webapi19sa-1.course.tamk.cloud/v1/weather/temperature/167");
    }
}

function chart_temp(sep_date,weatherData,period){

    const ctx=document.getElementById('weather_chart').getContext('2d');
    if(period==20){
        chartName="The Latest 20 Temperature Data";
    }
    else if(period==24){
        chartName="The Latest 24 Hourly Avg Temperature"
    }
    else if(period==48){
        chartName="The Latest 48 Hourly Avg Temperature"
    }
    else if(period==72){
        chartName="The Latest 72 Hourly Avg Temperature"
    }
    else{
        chartName="The Latest 1 Week Hourly Avg Temperature"
    }

    if(chart1!=null){
        chart1.destroy();
    }
        chart1=new Chart(ctx,{
            type: 'bar',
            data:{
                labels:sep_date,
                datasets: [{
                    data: weatherData,
                    backgroundColor:'reba(127,255,127,0.4)',
                    borderWidth:3,
                }]
            },
            options:{
                legend:{
                    display: false
                },
                scales:{
                    yAxes: [{
                        ticks:{
                            beginAtZero: true
                        }
                    }]
                },
                title:{
                    display:true,
                    text: chartName,
                },
                animation: false,
                events:[]
            }
          });

}
运行结果及报错内容
无法运行
我的解答思路和尝试过的方法
思路:原本的页面可以读取数据并传输到html,现在的想法是再点击button之后,里面能够出现新下拉菜单,并根据新下拉菜单选择的时间,读取不同的数据
框架已经构建好,我朋友用的是
- 方法,设计超链接,但是如果我想用button方法,不知道如何实现下拉菜单,已经构建好了一个select构建下拉菜单的框架在html,但无法与function名字连接
尝试方法:重新命名一个下拉菜单但无法实现我想要达到的结果
能够根据新下拉菜单选择的时间,显示出不同的数据读取


