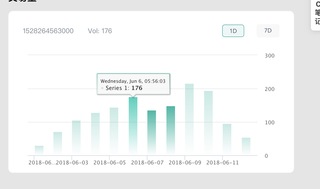
如上图当我把鼠标移动道柱子高亮改变该柱子颜色,当我鼠标移出后现在不能恢复原来的颜色
async setHoverColumnBg (chart) {
      if (!chart) return
      const { index: id = '' } = chart || {}
      if (!String(id)) return
      try {
        chart.series.data[id].color.linearGradient = { x1: 0, x2: 0, y1: 1, y2: 0 }
        chart.series.data[id].color.stops[0] = [0, 'rgba(0, 184, 164, 0)']
        if (chart.series.data[id].color.stops[1] == "[1, 'rgba(0, 184, 164, 1)']") {
          chart.series.data[id].color.stops[1] = [1, 'rgba(0, 184, 164, 0.3)']
        } else {
          chart.series.data[id].color.stops[1] = [1, 'rgba(0, 184, 164, 1)']
        }


      } catch (error) {
        console.log('error>>>', error);
      }

    },
    refreshGraphDataBox () {

    },
    async initHighchart () {
      await this.$nextTick()
      let self = this
      HighCharts.chart('volume', {
        title: {
          text: ''
        },
        chart: {
          type: 'column'
        },
        legend: {
          enabled: false
        },
        credits: {
          enabled: false
        },
        tooltip: {
          shared: true
        },
        xAxis: {
          //表示为时间,注意大小写
          type: 'datetime',
          //格式化时间,day,week....
          dateTimeLabelFormats: {
            day: '%Y-%m-%d'
          }
        },
        yAxis: {
          opposite: true,
          title: {
            text: ''
          }
        },
        plotOptions: {

          series: {

            point: {
              events: {
                mouseOver: function (e) {
                  console.log('鼠标移入>>', e, this);
                  self.curX = this.x
                  self.curY = this.y
                  self.setHoverColumnBg(this)
                }
              }
            },
            events: {
              mouseOut: function () {
                if (this.chart.lbl) {
                  this.chart.lbl.hide();
                }
                self.resetColumnBg(this)
              }
            }
          }
        },
        series: [
          {
            color: {
              linearGradient: { x1: 0, x2: 0, y1: 1, y2: 0 },
              stops: [
                [0, 'rgba(0, 184, 164, 0)'],
                [1, 'rgba(0, 184, 164, 0.3']
              ]
            },
            data: [[1527832563000, 29.9], [1527918791000, 71.5], [1528005191000, 106.4], [1528091591000, 129.2], [1528177991000, 144.0], [1528264563000, 176.0], [1528350963000, 135.6], [1528437363000, 148.5], [1528523763000, 216.4], [1528610163000, 194.1], [1528696563000, 95.6], [1528782963000, 54.4]]
          }
        ]
      });
    }
当我把鼠标移动道柱子高亮改变该柱子颜色,当我鼠标移出后恢复原来的颜色