我在vue2中使用echarts的时候用获取到的数据替换echarts实例的数据不能正常显示
代码
<template>
  <div>
    <div id="main" style="width: 600px;height:400px;"></div>
  </div>
</template>

<script>
export default {
    name:'StaAll',
    data() {
      return {
        // 查询条件
      empInfo:{
        currentPage:1,
        size:0,
      },
      dataList:[],
      tiptopDegreeKeys:[],
      tiptopDegreeValue:[],
      // 学历统计对象
      tiptopDegree:{
      },
      }
    },
    methods:{
      drawChart() {
      // 基于准备好的dom,初始化echarts实例
      console.log(this.tiptopDegreeKeys);
      console.log(this.tiptopDegreeValue);
      let myChart = this.$echarts.init(document.getElementById("main"));
      // 指定图表的配置项和数据
      let option = {
        title: {
          // text: "ECharts 入门示例"
        },
        tooltip: {},
        legend: {
          data: ["销量"]
        },
        xAxis: {
          // data: ["衬衫", "羊毛衫", "雪纺衫", "裤子", "高跟鞋", "袜子"]
          data: this.tiptopDegreeKeys
        },
        yAxis: {},
        series: [
          {
            name: "销量",
            type: "bar",
            // data: [5, 20, 36, 10, 10, 20]
            data:this.tiptopDegreeValue
          }
        ]
      };
      // 使用刚指定的配置项和数据显示图表。
      myChart.setOption(option);
    },
      // 获取员工数
      getMaxWorkID(){
        this.getRequest(`/system/basic/employee/maxWorkID`).then(resp=>{
          if(resp){
            this.empInfo.size = parseInt(resp.obj)
          }
          this.$nextTick(()=>{
              this.getData()
          })
        })
      },
      // 获取员工信息
      getData(){
        let url = '/system/basic/employee/?currentPage='+this.empInfo.currentPage+'&size='+this.empInfo.size
        this.getRequest(url).then(resp=>{
          this.dataList = resp.data
          let ary = {}
          // 统计各学历人数
          this.dataList.forEach(item=>{
            if(item.tiptopDegree in ary){
              ary[item.tiptopDegree] = ary[item.tiptopDegree] + 1
            }else{
              ary[item.tiptopDegree] = 1
            }
          })
          // 分开学历人数对象键值对
          for(let o in ary){
            this.tiptopDegreeKeys.push(o)
            this.tiptopDegreeValue.push(ary[o])
          }
        })
      },

    },
    beforeMount(){
      this.getMaxWorkID()
    },
    mounted(){
      this.drawChart()
    }
}
</script>

<style>

</style>
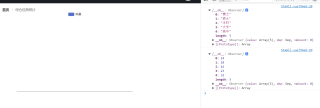
运行结果及报错内容
这是效果图,控制台的是我的数据( this.tiptopDegreeKeys和 this.tiptopDegreeValue)