
我有两个txt文件
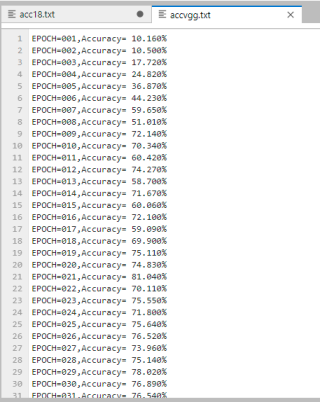
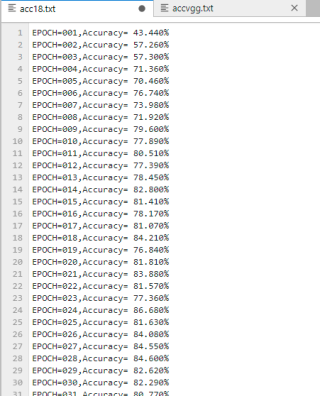
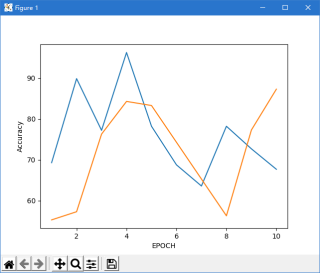
现在想让这两个txt文件中的内容合并,画出一个横轴位epoch,纵轴为两条acc折线。类似这种:

我有两个txt文件
 分享
分享
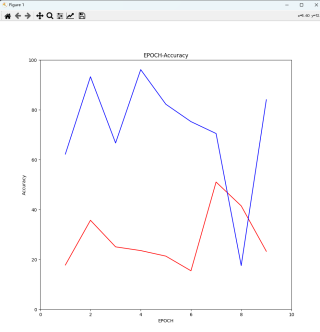
我自己生成了10组数据先试着话了一下,你看看:
from matplotlib import pyplot as plt

p = r'^EPOCH=(\d*),Accuracy= (\d*.\d*)%$'
x = []
y1 = []
y2 = []
with open('acc18.txt', 'r') as f1, open('accvgg.txt', 'r') as f2:
    lines1 = f1.readlines()
    lines2 = f2.readlines()
    #print(lines1,lines2)
    for line1, line2 in zip(lines1, lines2):
        x.append(int(line1[6:9]))
        y1.append(float(line1[20:-2]))
        y2.append(float(line2[20:-2]))
print(x,y1,y2)

plt.figure(figsize=(10,10))
plt.plot(x, y1, color='red', label='acc18', linestyle='-')
plt.plot(x, y2, color='blue', label='accvgg', linestyle='-')
plt.xlim([0.0, len(x)+1])
plt.ylim([0.0, 100.0])
plt.xlabel('EPOCH')
plt.ylabel('Accuracy')
plt.title('EPOCH-Accuracy')
plt.show()
分享 系统已结题
5月19日
系统已结题
5月19日 已采纳回答
5月11日
创建了问题
5月11日
已采纳回答
5月11日
创建了问题
5月11日


